the Creative Commons Attribution 4.0 License.
the Creative Commons Attribution 4.0 License.
 | 16 May 2024
Brazilian Atmospheric Inventories – BRAIN: a comprehensive database of air quality in Brazil
Leonardo Hoinaski
Robson Will
Camilo Bastos Ribeiro
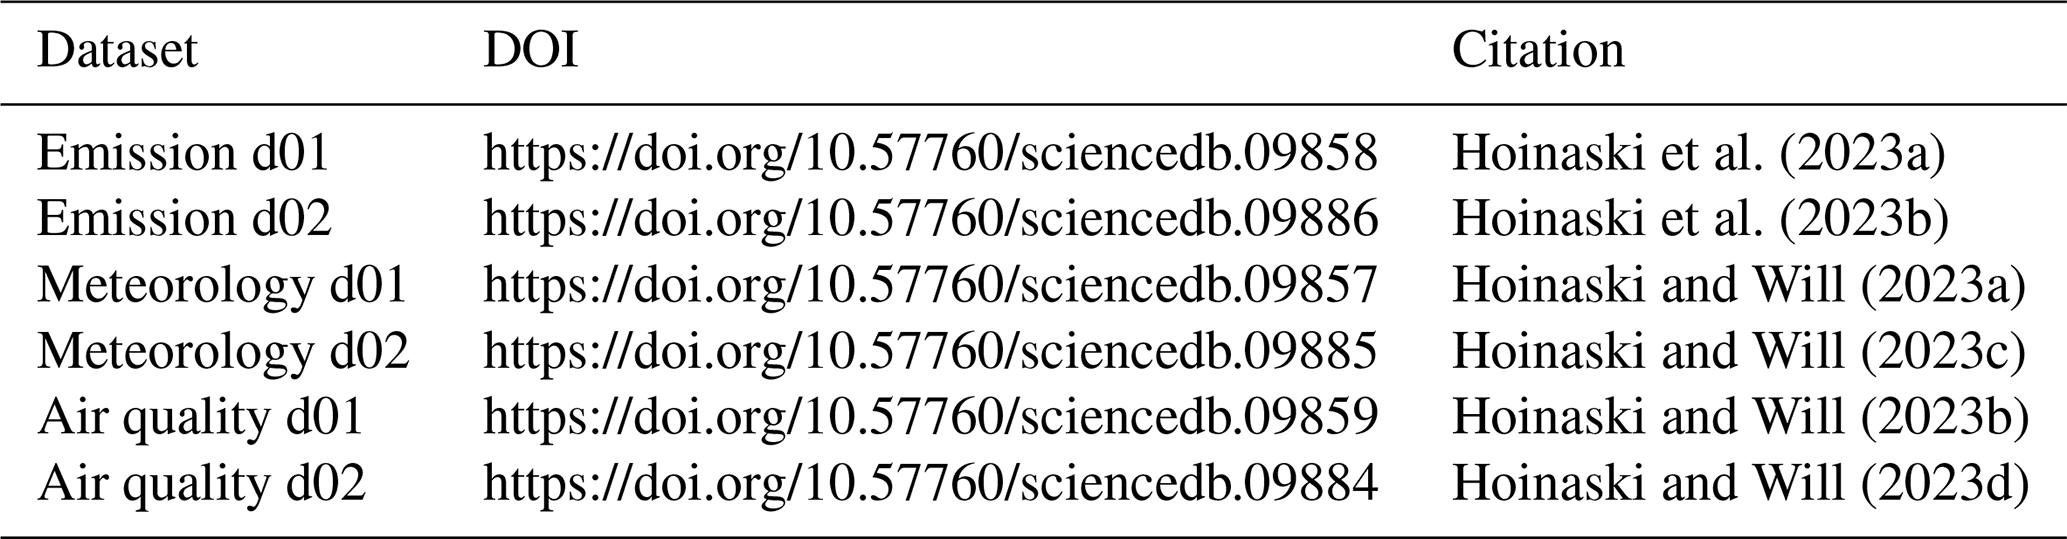
Developing air quality management systems to control the impacts of air pollution requires reliable data. However, current initiatives do not provide datasets with large spatial and temporal resolutions for developing air pollution policies in Brazil. Here, we introduce the Brazilian Atmospheric Inventories (BRAIN), the first comprehensive database of air quality and its drivers in Brazil. BRAIN encompasses hourly datasets of meteorology, emissions, and air quality. The emissions dataset includes vehicular emissions derived from the Brazilian Vehicular Emissions Inventory Software (BRAVES), industrial emissions produced with local data from the Brazilian environmental agencies, biomass burning emissions from FINN – Fire INventory from the National Center for Atmospheric Research (NCAR), and biogenic emissions from the Model of Emissions of Gases and Aerosols from Nature (MEGAN) (https://doi.org/10.57760/sciencedb.09858, Hoinaski et al., 2023a; https://doi.org/10.57760/sciencedb.09886, Hoinaski et al., 2023b). The meteorology dataset has been derived from the Weather Research and Forecasting Model (WRF) (https://doi.org/10.57760/sciencedb.09857, Hoinaski and Will, 2023a; https://doi.org/10.57760/sciencedb.09885, Hoinaski and Will, 2023c). The air quality dataset contains the surface concentration of 216 air pollutants produced from coupling meteorological and emissions datasets with the Community Multiscale Air Quality Modeling System (CMAQ) (https://doi.org/10.57760/sciencedb.09859, Hoinaski and Will, 2023b; https://doi.org/10.57760/sciencedb.09884, Hoinaski and Will, 2023d). We provide gridded data in two domains, one covering the Brazilian territory with 20×20 km spatial resolution and another covering southern Brazil with 4×4 km spatial resolution. This paper describes how the datasets were produced, their limitations, and their spatiotemporal features. To evaluate the quality of the database, we compare the air quality dataset with 244 air quality monitoring stations, providing the model's performance for each pollutant measured by the monitoring stations. We present a sample of the spatial variability of emissions, meteorology, and air quality in Brazil from 2019, revealing the hotspots of emissions and air pollution issues. By making BRAIN publicly available, we aim to provide the required data for developing air quality policies on municipal and state scales, especially for under-developed and data-scarce municipalities. We also envision that BRAIN has the potential to create new insights into and opportunities for air pollution research in Brazil.
- Article
(13528 KB) - Full-text XML
-
Supplement
(215138 KB) - BibTeX
- EndNote


It is consensus that air pollution threatens public health (OECD, 2024), economic progress (OECD, 2016), and climate (US EPA, 2023a). The negative outcomes associated with air pollution are not uniform within populations, and the impacts may be greater for more susceptible and exposed individuals (Makri and Stilianakis, 2008). Due to their social vulnerability and increasing emissions, developing countries urgently require reliable databases to provide information for designing air quality management systems to control air pollution (Sant'Anna et al., 2021).
Brazil has continental dimensions, is the seventh most populous country in the world, and has the 12th largest gross domestic product (IBGE, 2024). The combination of poorly planned development and the huge socioeconomic discrepancy has led to air quality impacts in Brazil. Air-pollution-related problems are not only restricted to great Brazilian cities and industrialized areas. Vehicular fleets and fuel consumption have also increased in small municipalities (CEIC, 2021; MME, 2023), posing a challenge to controlling vehicular emissions. In preserved and rural areas, large fire emissions have occurred due to illegal deforestation and poor soil management (Escobar, 2019; Rajão et al., 2020).
Following the practices of developed countries, Brazilian air quality policies have been enforced through legislative laws, using air quality standards as key components. However, the air quality management system remains incomplete in Brazil, with policies falling short of effectiveness due to a lack of air quality monitoring data across much of the country, primarily limited to well-developed areas (Sant'Anna et al., 2021). Moreover, Brazilian environmental agencies have not provided enough data and guidance to permit progress. Air quality consultants are still struggling to find mandatory inputs to understand and predict air quality for regulatory purposes. Efforts toward the permanent improvement of high-spatiotemporal-resolution emissions inventories and of meteorological and air quality data are needed.
An effective air quality management system must provide data to determine what emission reductions are needed to achieve the air quality standards (US EPA, 2023b). It requires air quality monitoring, a robust and detailed emissions inventory, reliable meteorological datasets, and methodologies to adapt the state-of-the-art air quality models to Brazil's reality. Moreover, it is crucial to undertake ongoing evaluation and to fully understand the air quality problem to design and implement the programs for pollution control. Currently, available initiatives including reanalysis and satellite products are still not providing datasets with large spatial and temporal resolutions for developing air pollution policies in Brazil. Global reanalyses such as the Copernicus Atmospheric Monitoring Service (CAMS) (Inness et al., 2019) and the second version of the Modern-Era Retrospective Analysis for Research and Applications (MERRA-2) (GMAO, 2015a, b) can provide estimates of air pollutants by combining chemical transport models (CTMs) with satellite and ground-based observations and physical information, assimilating data to constrain the results. However, the currently available reanalysis products do not provide data with high spatial resolution (up to 0.75° × 0.75° and 0.5° × 0.625°) and could be biased toward representing local and regional air quality (Arfan Ali et al., 2022). Moreover, they provide data for only a small list of air pollutants. Satellite-based products such as Sentinel-5P TROPOMI (Veefkind et al., 2012) and the Moderate-Resolution Imaging Spectroradiometer (MODIS) (Levy et al., 2015; Platnick et al., 2015) are still challenging due to their low temporal resolution, data gaps due to cloud coverage, and uncertainties (Shin et al., 2020). Besides, satellites rely on total tropospheric column measurements, which do not represent surface concentrations (Shin et al., 2019).
In this article, we present the Brazilian Atmospheric Inventories (BRAIN), the first comprehensive database to elaborate upon air quality management systems in Brazil. BRAIN combines local inventories, consolidated datasets, and the usage of internationally recommended models to provide hourly emissions and meteorological and air quality data covering the entire country.
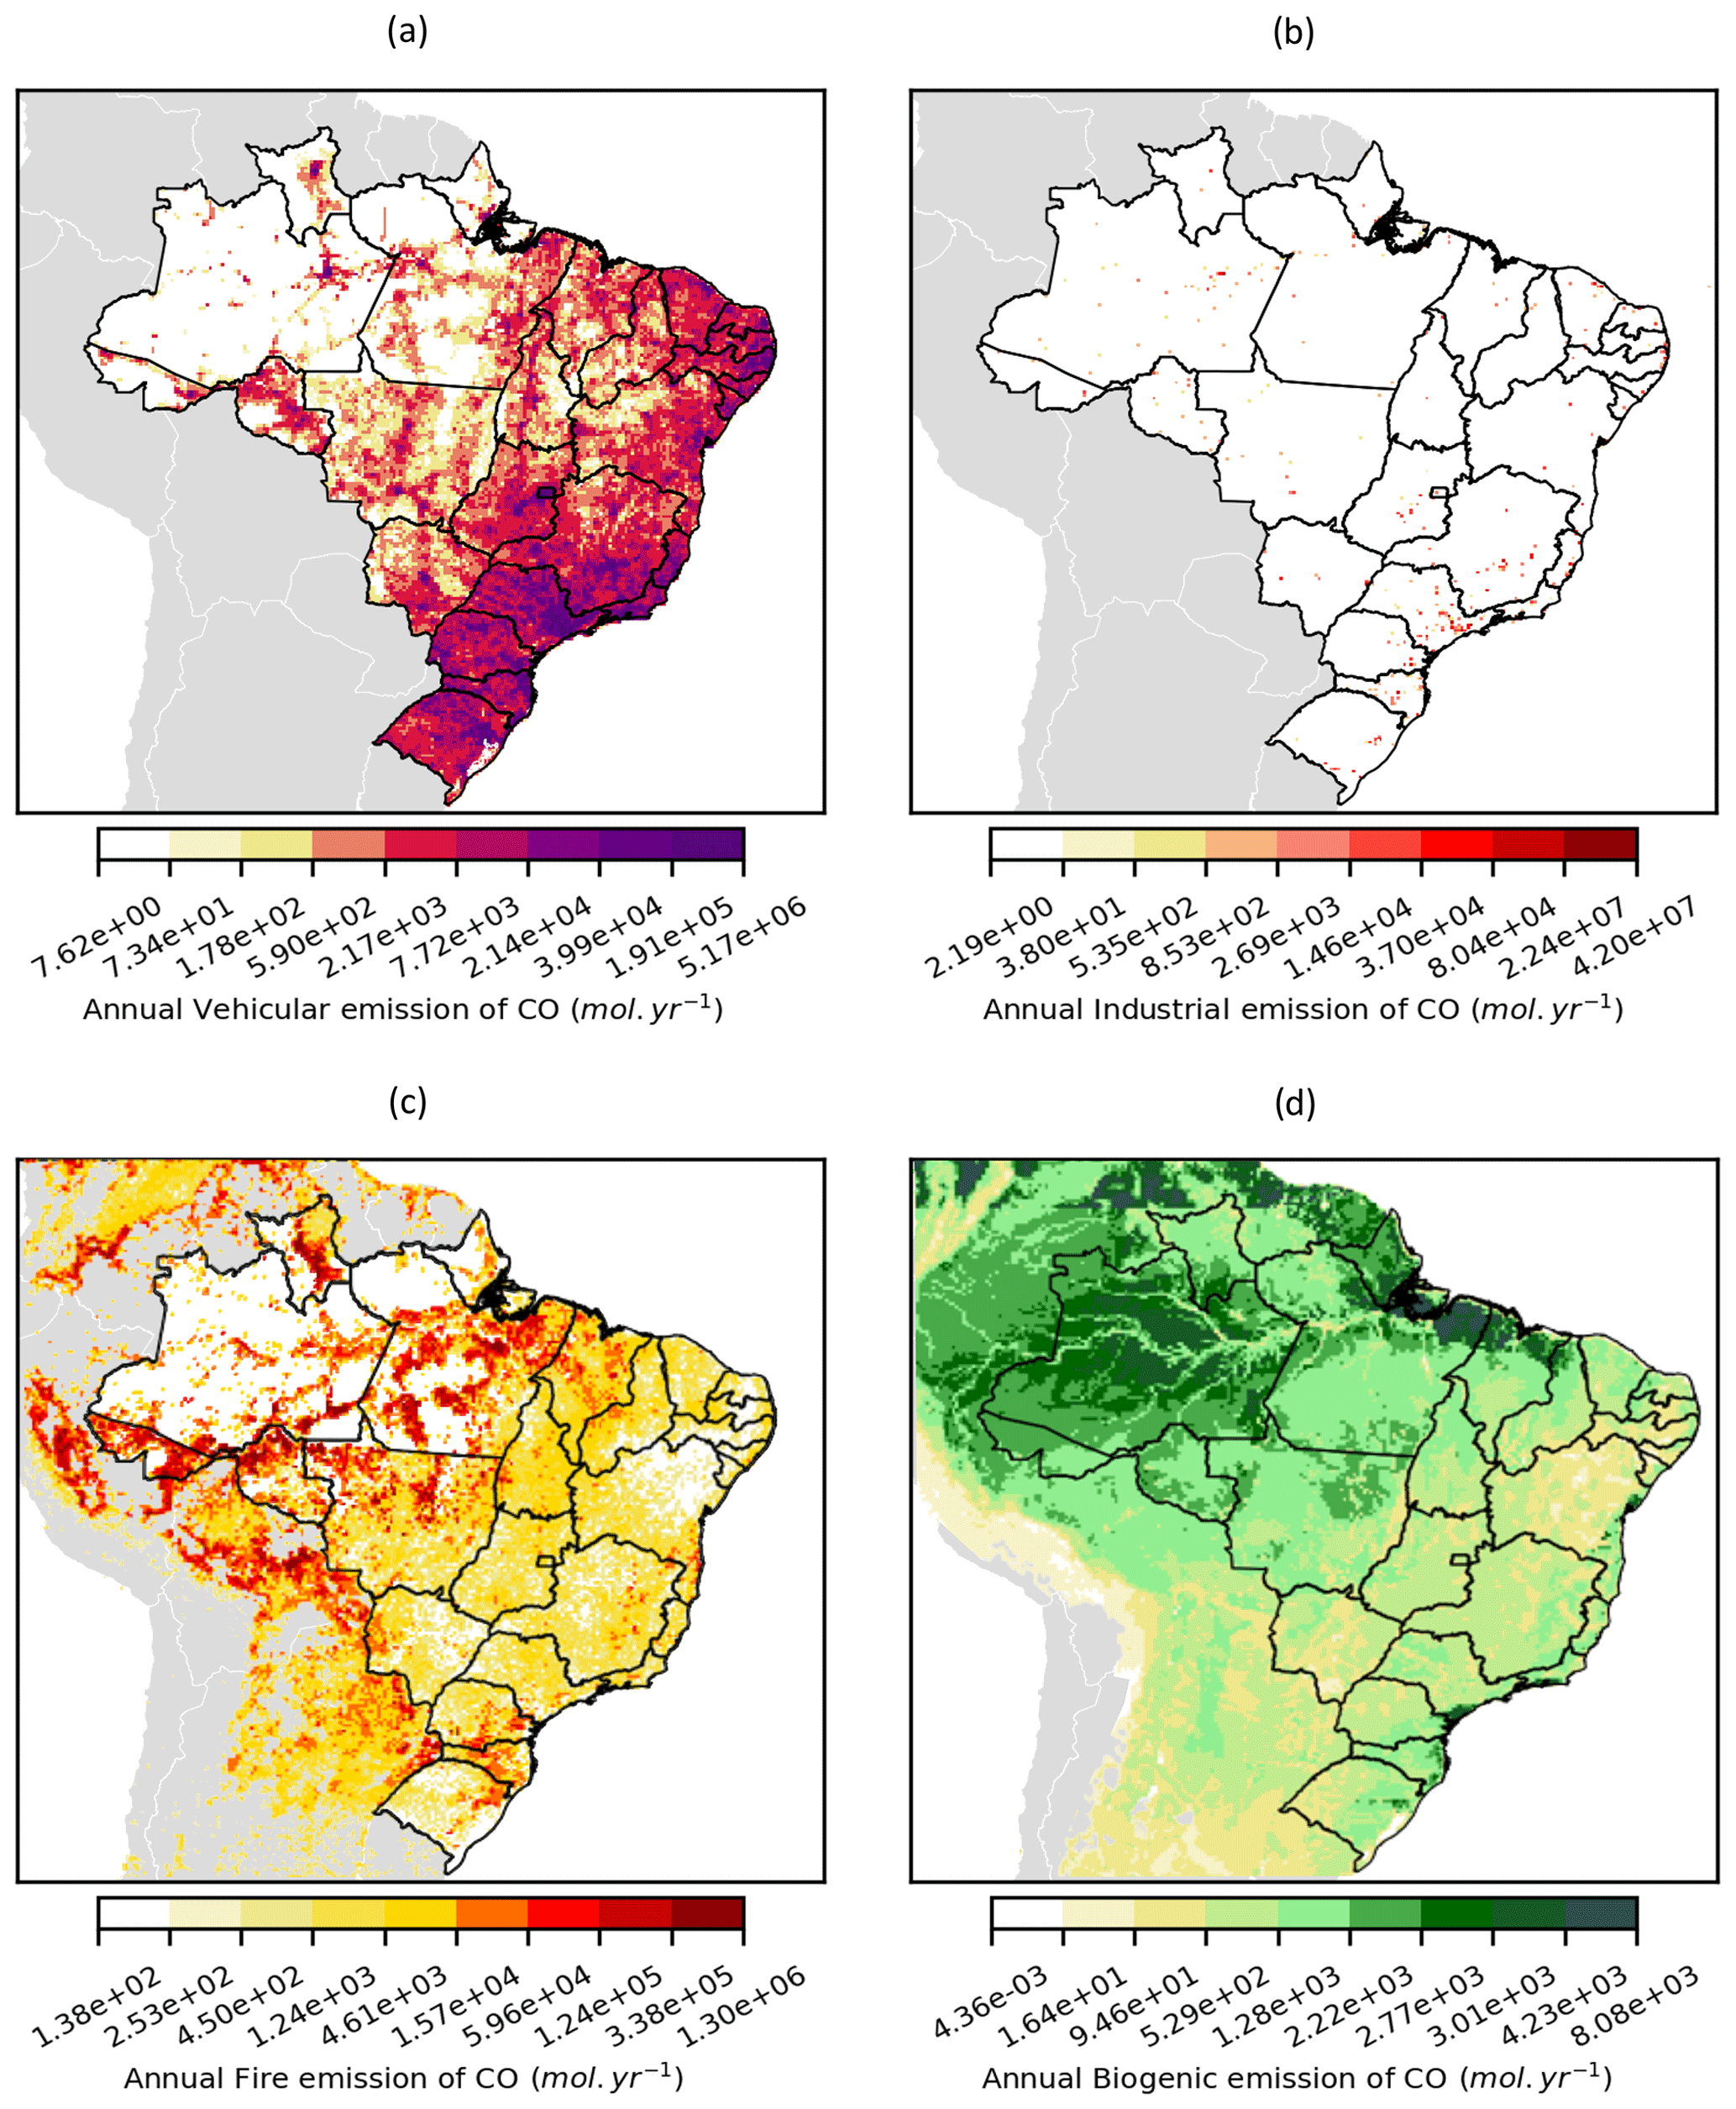
Figure 1Spatial distribution of CO emissions from (a) vehicles, (b) industries, (c) biomass burning, and (d) biogenic sources, as provided by BRAIN.
BRAIN contains three types of hourly datasets: emissions, meteorology, and air quality. The emissions inventories include vehicular, industrial, biogenic, and biomass burning emissions. We provide meteorological data derived from the Weather Research and Forecasting (WRF) model. Coupling emissions, WRF, and the Community Multiscale Air Quality Modeling System (CMAQ) version 5.3.2, we provide air quality gridded data. All datasets are available on two spatial resolutions: the largest (Fig. S1 in the Supplement – d01) covers the entire country, while the smallest covers southern Brazil (Fig. S1 – d02). The BRAIN datasets in d01 are freely available at https://doi.org/10.57760/sciencedb.09858 (Hoinaski et al., 2023a), https://doi.org/10.57760/sciencedb.09857 (Hoinaski and Will, 2023a), and https://doi.org/10.57760/sciencedb.09859 (Hoinaski and Will, 2023b). The BRAIN datasets in d02 are available at https://doi.org/10.57760/sciencedb.09886 (Hoinaski et al., 2023b), https://doi.org/10.57760/sciencedb.09885 (Hoinaski and Will, 2023c), and https://doi.org/10.57760/sciencedb.09884 (Hoinaski and Will, 2023d). The Federal University of Santa Catarina (UFSC) institutional repository, https://brain.ens.ufsc.br/ (last access: 8 May 2024), and the web platform, https://hoinaski.prof.ufsc.br/BRAIN/ (last access: 8 May 2024), have served the BRAIN database since 2019. We envision making available more detailed datasets for other Brazilian regions, especially in the southeast, where the anthropogenic emission effects are more prominent. Future versions will also provide more detailed modeling outputs to properly cover medium- and small-sized cities.
BRAIN is intended to fill the gaps in those cases where adequately representative monitoring data to characterize the air quality are not available. BRAIN would be useful in providing background concentrations for a good procedure for licensing new sources of air pollution.
2.1 Emissions inventory
The BRAIN emissions inventory allows the spatiotemporal analysis of vehicular, industrial, biomass burning, and biogenic emissions in Brazil. The present version of this database does not account for other South American countries' emissions, apart from biomass burning and biogenic sources. We envision implementing other sources and a more detailed emissions inventory from other South American countries in a future version. Figure 1 presents a sample of the inventory, showing the annual carbon monoxide (CO) emissions by source. Section S2 in the Supplement (Table S1) summarizes the species in each emission source inventory. More information on each emissions dataset can be found in Sect. 2.1.1 to 2.1.5.
We observed higher vehicular emission rates of CO in urban areas with large population and vehicle fleet densities, mainly in the south and southeast (Fig. 1a). High industrial emission rates have been detected in the Brazilian regions, with large stationary sources such as refining units, thermoelectric power plants, and cement and paper industries (Fig. 1b) (Kawashima et al., 2020). In general, the north shows a higher concentration of biogenic and fire emissions. While the hotspots of biogenic emissions are predominately in the extreme north, the hotspots of fire emissions turn up in the midwestern, northern, and southern regions, as well as on the Brazilian western border (Fig. 1c–d).
2.1.1 Vehicular emissions
BRAIN uses the multispecies and high-spatiotemporal-resolution database of vehicular emissions from the Brazilian Vehicular Emission Inventory Software (BRAVES) (Hoinaski et al., 2022; Vasques and Hoinaski, 2021). The BRAVES database disaggregates municipality-aggregated emissions using the road density approach and temporal disaggregation based on vehicular flow profiles. SPECIATE 5.1 (Eyth et al., 2020) from the United States Environmental Protection Agency (USEPA, https://www.epa.gov/air-emissions-modeling/speciate, last access: 8 May 2024) speciates conventional pollutants in 41 species. BRAVES considers local studies (Nogueira et al., 2015) and data from Companhia Ambiental do Estado de São Paulo (CETESB) (https://cetesb.sp.gov.br/veicular/relatorios-e-publicacoes/, last access: 8 May 2024) to speciate acetaldehydes, formaldehyde, ethanol, and aldehydes in order to account for biofuel particularities in Brazil.
In BRAVES, vehicular activity is defined by fuel consumption in each municipality using data provided by the Brazilian National Agency for Oil, Natural Gas and Biofuel (ANP) (https://www.gov.br/anp/pt-br/centrais-de-conteudo/dados-abertos/vendas-de-derivados-de-petroleo-e-biocombustiveis, last access: 8 May 2024). A fraction of fuel consumed by road transportation is based on data from the National Energy Balance (BEN) (https://www.epe.gov.br/pt/publicacoes-dados-abertos/publicacoes/balanco-energetico-nacional-ben, last access: 8 May 2024), and MMA (2014). BRAVES calculates the weighted emission factor (EF) to address the effect of the fleet composition in terms of category, model year, and fuel utilization.
Vasques and Hoinaski (2021) compared BRAVES with different vehicular emission inventories from a local to national scale. On a national scale, vehicular emission rates from BRAVES underestimate the Emission Database for Global Atmospheric Research (EDGAR) and are slightly higher for CO (14 %) and non-methane volatile organic compounds (NMVOCs) (9 %) compared with the national inventory from Ministério do Meio Ambiente (MMA). The differences between estimates from BRAVES and from well-developed state inventories vary from −1 % to 35 % in São Paulo and from −2 % to 52 % in Minas Gerais. In addition, a relatively small bias between BRAVES and the Vehicular Emission Inventory (VEIN) was observed in São Paulo and Vale do Paraiba (Vasques and Hoinaski, 2021).
2.1.2 Industrial emissions
We derived the industrial emissions inventory by combining data from the state environmental agencies of Espírito Santo, Minas Gerais, and Santa Catarina. The emission rates of point sources from Espírito Santo and Minas Gerais are publicly provided by Instituto de Meio Ambiente e Recursos Hídricos do Espírito Santo (IEMA-ES) (https://iema.es.gov.br/qualidadedoar/inventariodefontes, last access: 8 May 2024) and Fundação Estadual de Meio Ambiente (FEAM) (http://www.feam.br/qualidade-do-ar/emissao-de-fontes-fixas, last access: 8 May 2024). Data from IEMA-ES contain emissions from the metropolitan region of Vitória from 2015, compiling measurements from regulatory procedures and emissions estimates. We did not convert the emissions inventory to the current modeling year since the data are not continuously updated. Therefore, we assumed that all emissions from these sources occurred in 2019.
In Santa Catarina, industrial emission data have been provided by Instituto de Meio Ambiente (IMA) (https://www.ima.sc.gov.br/index.php, last access: 8 May 2024). These data are collected in the licensing process of potentially polluting industries. The base year of emission rates varies according to the availability. Summary information about the industrial sector types, the number of industries, and the respective emission rates in Santa Catarina can be found in Hoinaski et al. (2020) and at https://github.com/leohoinaski/IND_Inventory/blob/main/Inputs/BR_Ind.xlsx (last access: 8 May 2024). Emissions from large stationary sources (refining units, thermoelectric power plants, cement, and paper industries) provided by Kawashima et al. (2020) have been included when not encountered in the environmental agencies' inventories.
We chemically speciated the industrial emission rates by adopting the following steps: (i) grouping each point source using the same categories as in the Emission Database for Global Atmospheric Research (EDGAR) (Crippa et al., 2018) and the Intergovernmental Panel on Climate Change (IPCC) industrial segments, (ii) selecting compatible profiles in SPECIATE 5.1 for each group (Eyth et al., 2020), (iii) averaging the speciation factor by group and pollutant, and (iv) applying the speciation factor for the targeted pollutant (PM, NOx, VOCs). The SPECIATE 5.1 profiles used in this work are listed at https://github.com/leohoinaski/IND_Inventory/tree/main/IndustrialSpeciation (last access: 8 May 2024). The speciation factors by industrial group and pollutant are available at https://github.com/leohoinaski/IND_Inventory/blob/main/IndustrialSpeciation/IND_speciation.csv (last access: 8 May 2024).
We also vertically allocate the industrial emissions according to the plume's effective height, estimated by the sum of the geometric height and the superelevation of the plume. The plume superelevation was estimated by the Briggs method (Briggs, 1975, 1969). The initial vertical distribution of the plume has been estimated by disaggregating the emissions using a Gaussian approach, as proposed in the Sparse Matrix Operator Kernel Emissions (SMOKE) model (Bieser et al., 2011; Gordon et al., 2018; Guevara et al., 2014). Python code to estimate the plume's effective height and the initial vertical disaggregation of industrial emissions is available at https://doi.org/10.5281/zenodo.11167115 (Hoinaski, 2024a).
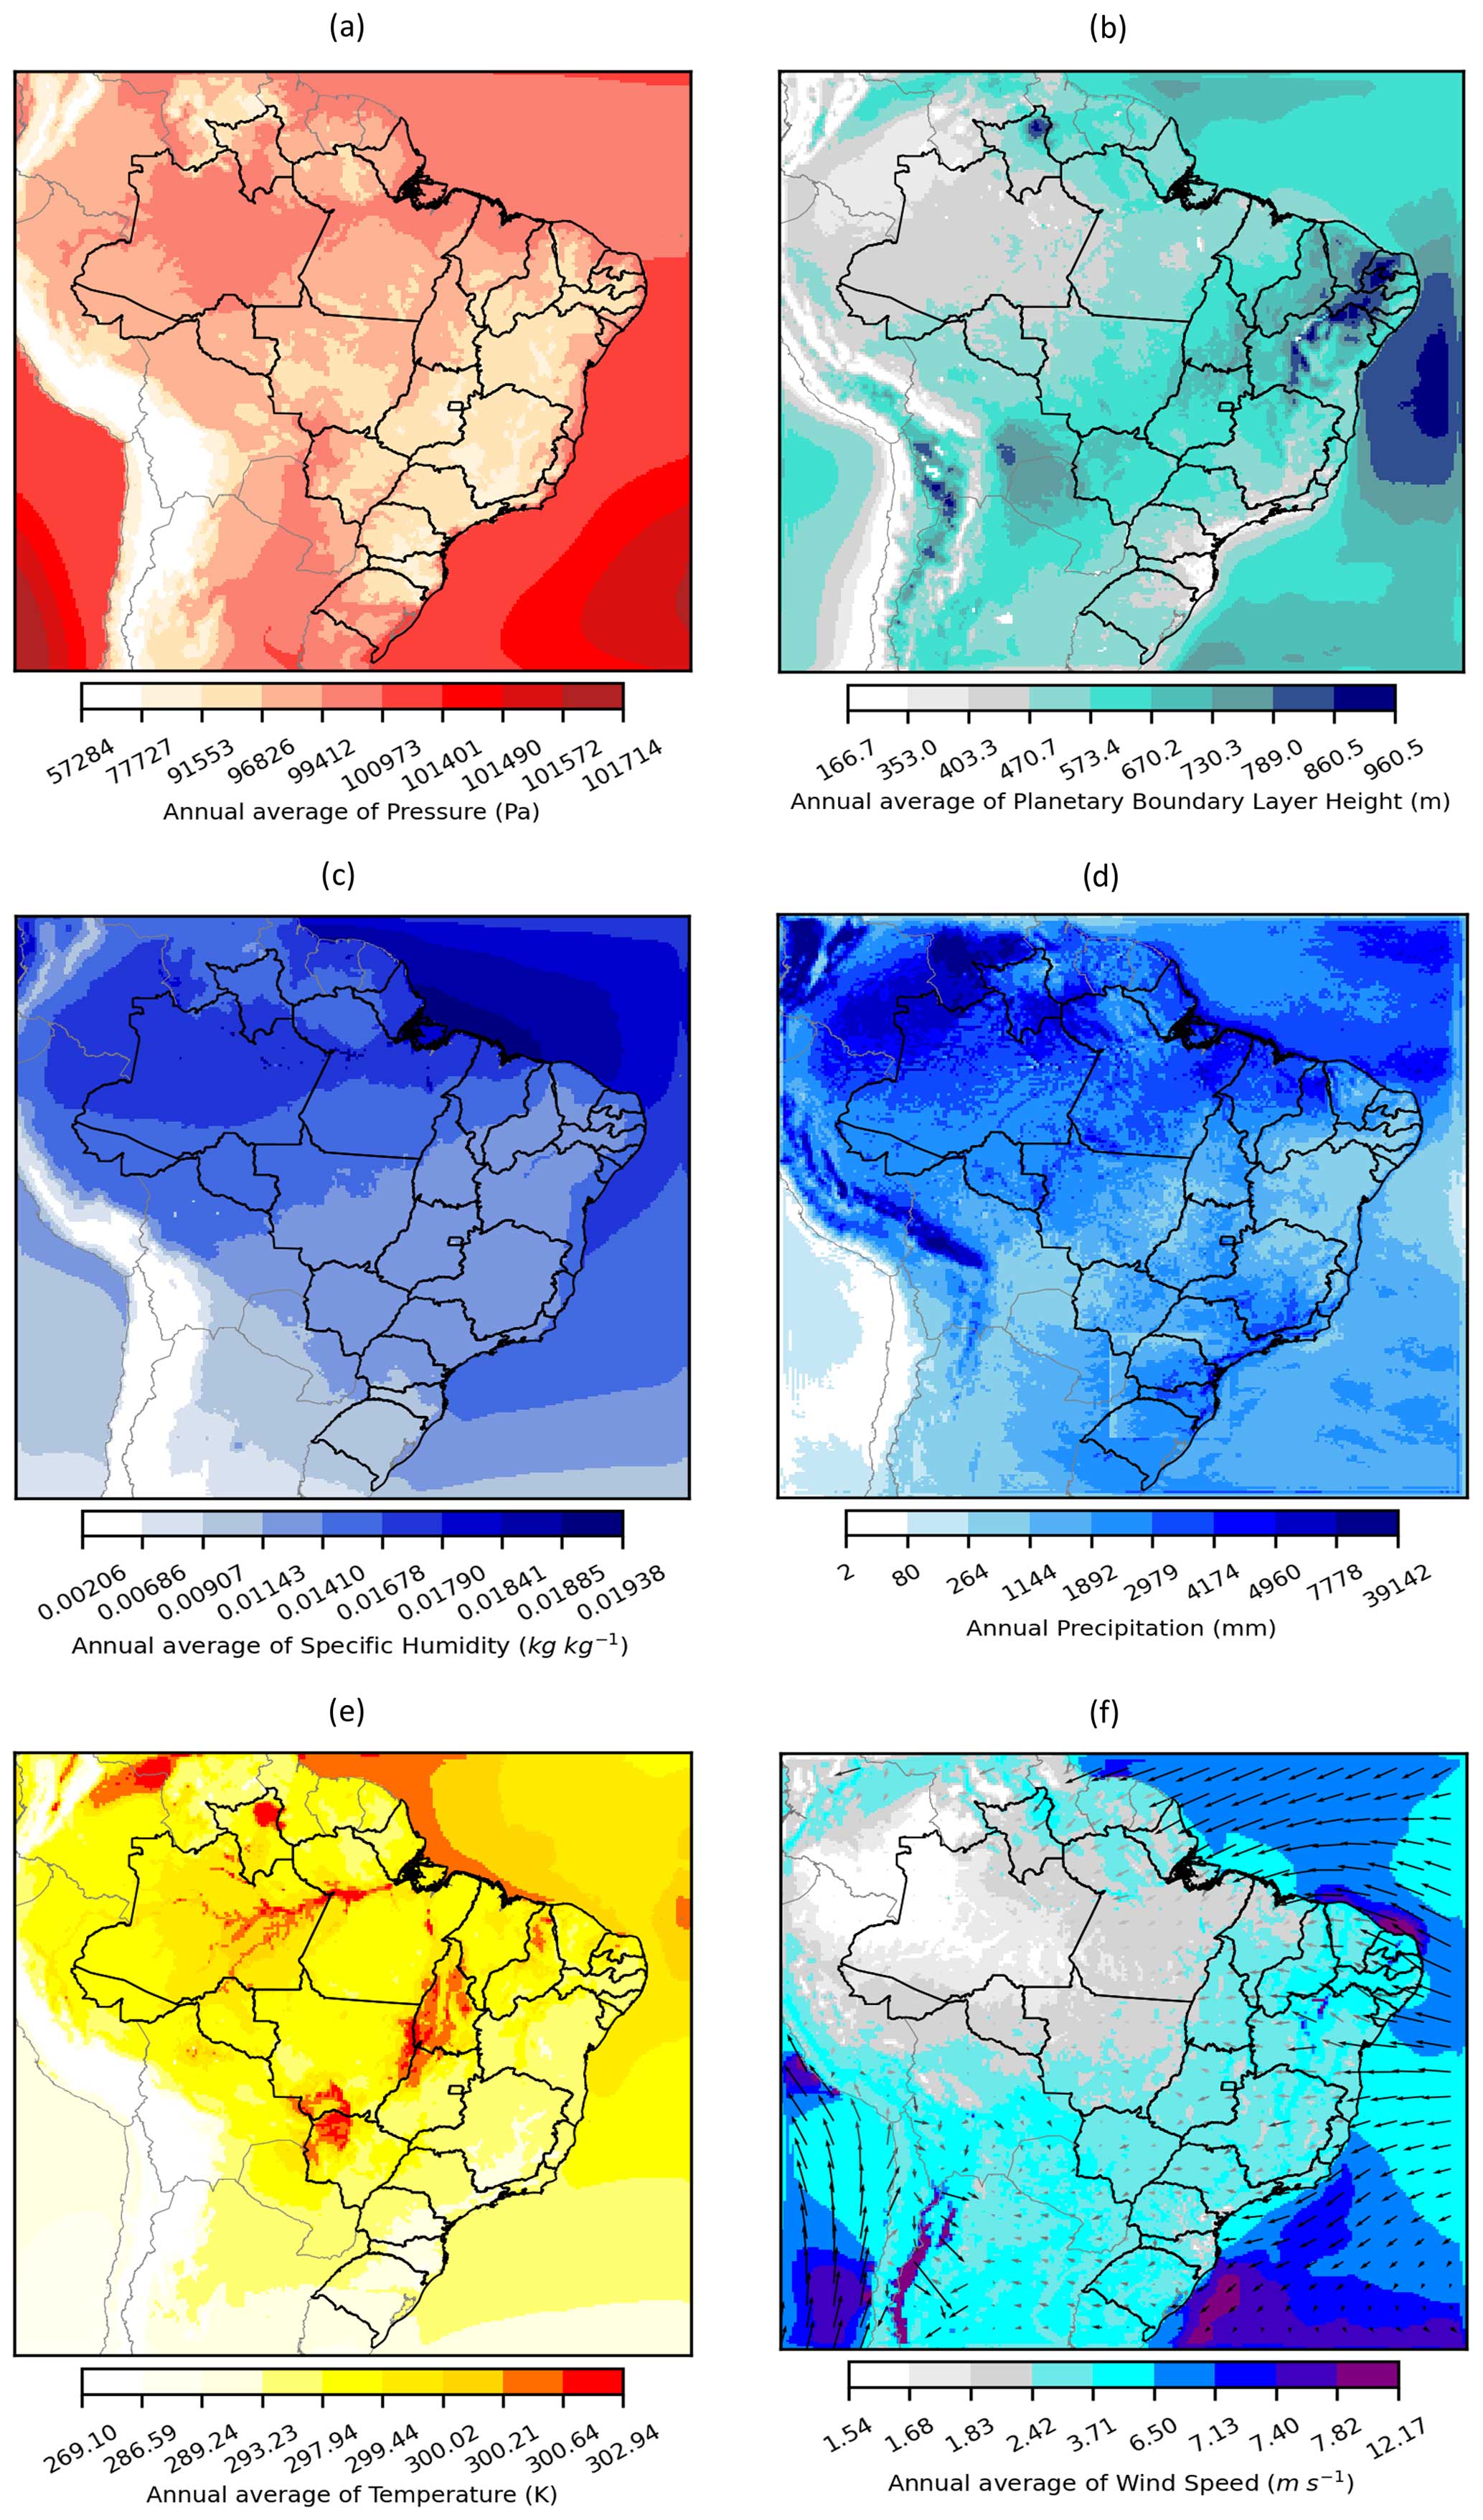
Figure 2Annual average of meteorological variables in 2019, simulated by the WRF with 20 × 20 km resolution. (a) Atmospheric pressure, (b) planetary boundary layer height, (c) specific humidity, (d) annual accumulated precipitation, (e) temperature, (f) wind intensity and direction. All variables are annual averages except for precipitation, which represents the annual accumulated total.
2.1.3 Biomass burning emissions
The Fire INventory from NCAR (FINN) version 1.5 (Wiedinmyer et al., 2011) provides data on biomass burning emissions in BRAIN. FINN outputs contain daily emissions of trace gas and particle emissions from wildfires, agricultural fires, and prescribed burnings and do not include biofuel use and trash burning. Datasets have a 1 km spatial resolution and are available at https://www.acom.ucar.edu/Data/fire/ (last access: 8 May 2024).
Since CMAQ requires hourly emissions, a Python code (https://github.com/barronh/finn2cmaq, last access: 8 May 2024) temporally disaggregates daily emissions into hourly emissions. The same code vertically splits the fire emissions to consider the plume rise effect and represents the vertical distribution (Henderson, 2022), converting text files into hourly 3D netCDF files.
Pereira et al. (2016) suggest that fire emissions estimated by FINN are strongly related to deforestation in many Brazilian regions. FINN estimates have a high correlation with both the Brazilian Biomass Burning Emission Model (3BEM) (0.86) and the Global Fire Assimilation System (GFAS) (0.84). The emissions estimated from FINN are commonly overestimated in comparison to other biomass burning emission inventories. An overestimation also occurs when FINN is used in air quality models and compared with observations. However, the use of FINN as input in air quality models can capture the temporal variability of pollutants emitted by biomass burning (Vongruang et al., 2017).
We have implemented the FINN v1.5 in this first version of BRAIN. However, FINN version 2.5 (Wiedinmyer et al., 2023) will be included in our emissions inventory in future work; this version uses an updated algorithm for determining fire size based on MODIS and Visible Infrared Imaging Radiometer Suite (VIIRS) satellite instruments. We also provide data from 2020 with the same modeling grid upgraded to FINN v2.5.
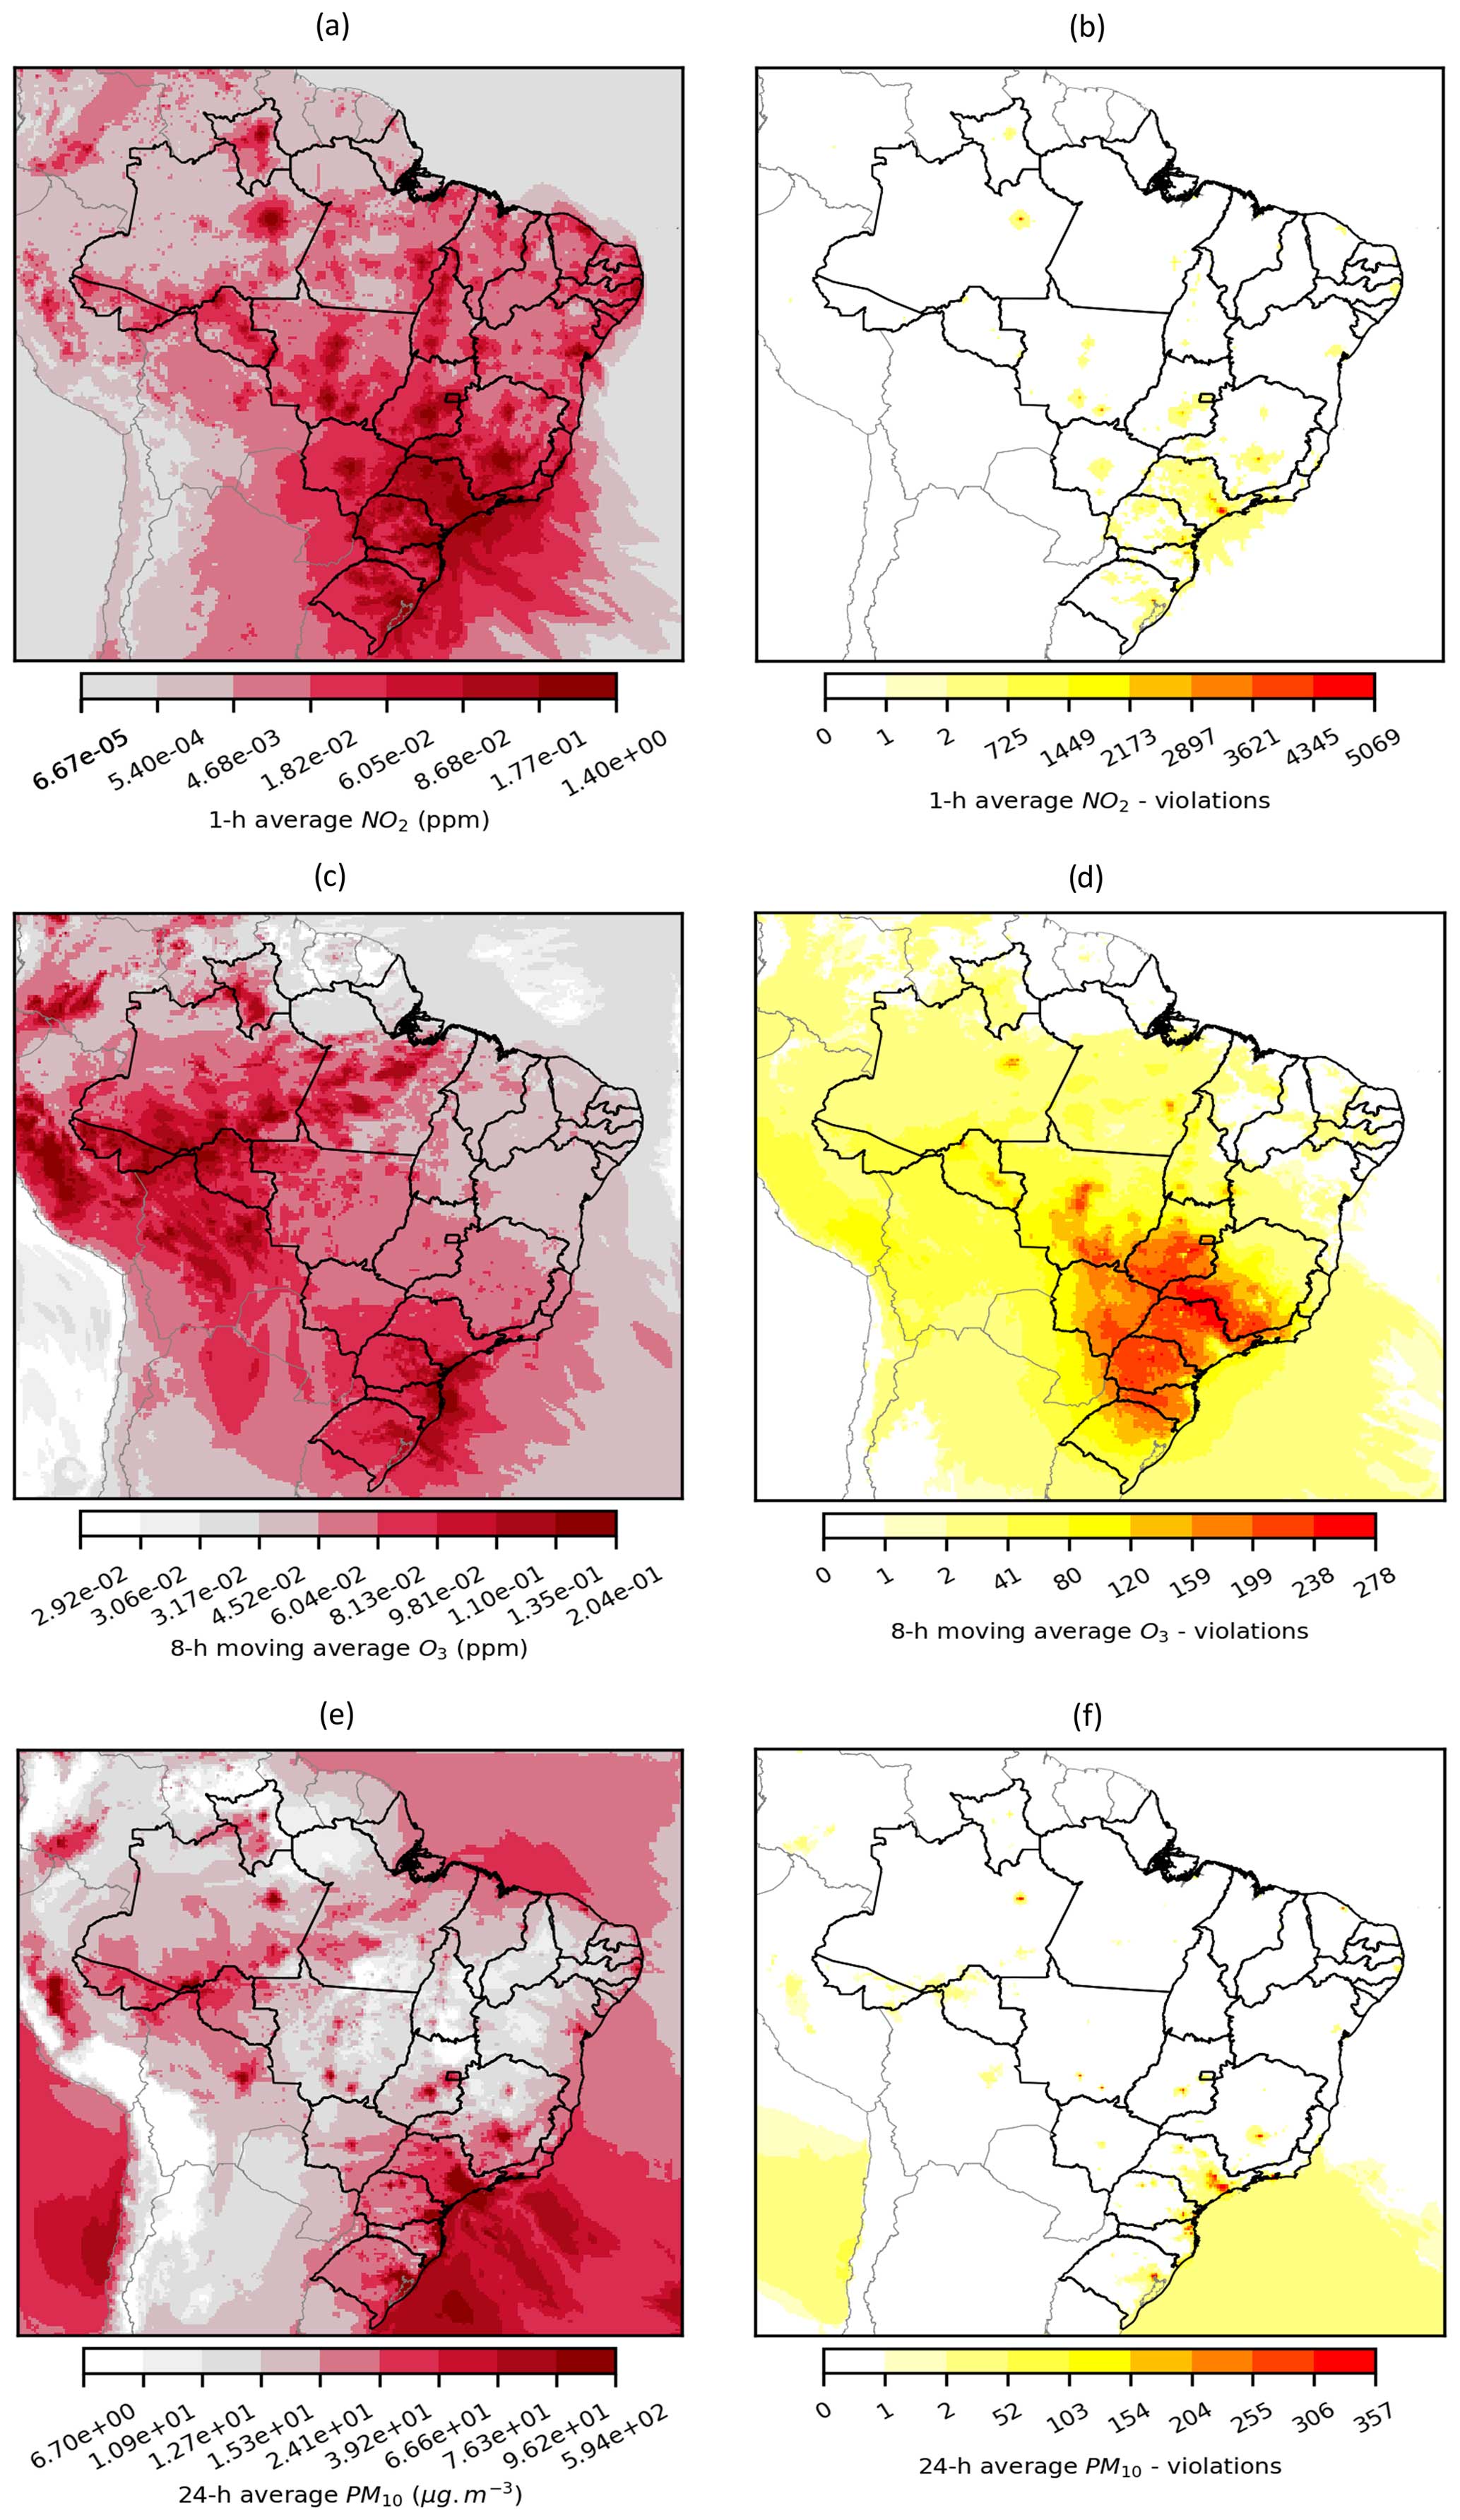
Figure 3Spatial distribution of air pollutant concentration (a, c, e) and number of violations of air quality standards (b, d, f) for NO2 (a–b), O3 (c–d), and PM10 (e–f).
2.1.4 Biogenic emissions
We derived the biogenic emissions using the Model of Emissions of Gases and Aerosols from Nature (MEGAN) version 3.2 (Guenther et al., 2012; Silva et al., 2020). MEGAN is based on the leaf area index and plant functional groups. The model estimates emissions of gases and aerosols for different meteorological conditions and land cover types (Guenther et al., 2012). The leaf-level temperature and photosynthetically active radiation, as well as the vegetative stress conditions implemented in MEGAN, provide more physically realistic parameterizations for biosphere–atmosphere interactions (Silva et al., 2020). Input datasets, emission factor processors, and emission estimation modules are available at https://bai.ess.uci.edu/megan/data-and-code (last access: 8 May 2024). Data from WRF and the Meteorology-Chemistry Interface Processor (MCIP) have been used in MEGAN simulations.
MEGAN is commonly adopted to estimate emissions from biogenic fluxes, which constitute an important input for air quality modeling in many regions worldwide (Hogrefe et al., 2011; Kitagawa et al., 2022; Kota et al., 2015). Although MEGAN overestimates nighttime biogenic fluxes, the modeled emissions are correlated with measurements in the Amazon during both wet and dry seasons. The model is capable of capturing relatively well the seasonal variability of important organic pollutants in tropical forests (Sindelarova et al., 2014).
2.1.5 Sea spray aerosol emissions
Sea spray aerosol (SSA) is an important source of particles in the atmosphere. Due to its properties, SSA influences gas–particle partitioning in coastal environments (Gantt et al., 2015). SSA has been implemented in CMAQ as an inline source and requires the input of an ocean mask file (OCEAN) to identify the fractional coverage in each model grid cell allocated to the open ocean (OPEN) or surf zone (SURF). CMAQ uses this coverage information to calculate sea spray emission fluxes from the model's grid cells (US EPA, 2022). Detailed information on the mechanism of sea spray aerosol emissions and its implementation in CMAQ can be found in Gantt et al. (2015).
We provide a Python code (https://github.com/leohoinaski/CMAQrunner/blob/master/hoinaskiSURFZONEv2.py, last access: 8 May 2024) to reproduce the OCEAN time-independent Input/Output Applications Programming Interface (I/O API) (https://www.cmascenter.org/ioapi/, last access: 8 May 2024) file so that it is ready to use in CMAQ. This code uses a shoreline Environmental Systems Research Institute (ESRI) shapefile from the National Oceanic and Atmospheric Administration (NOAA), available at https://www.ngdc.noaa.gov/mgg/shorelines/ (last access: 8 May 2024).
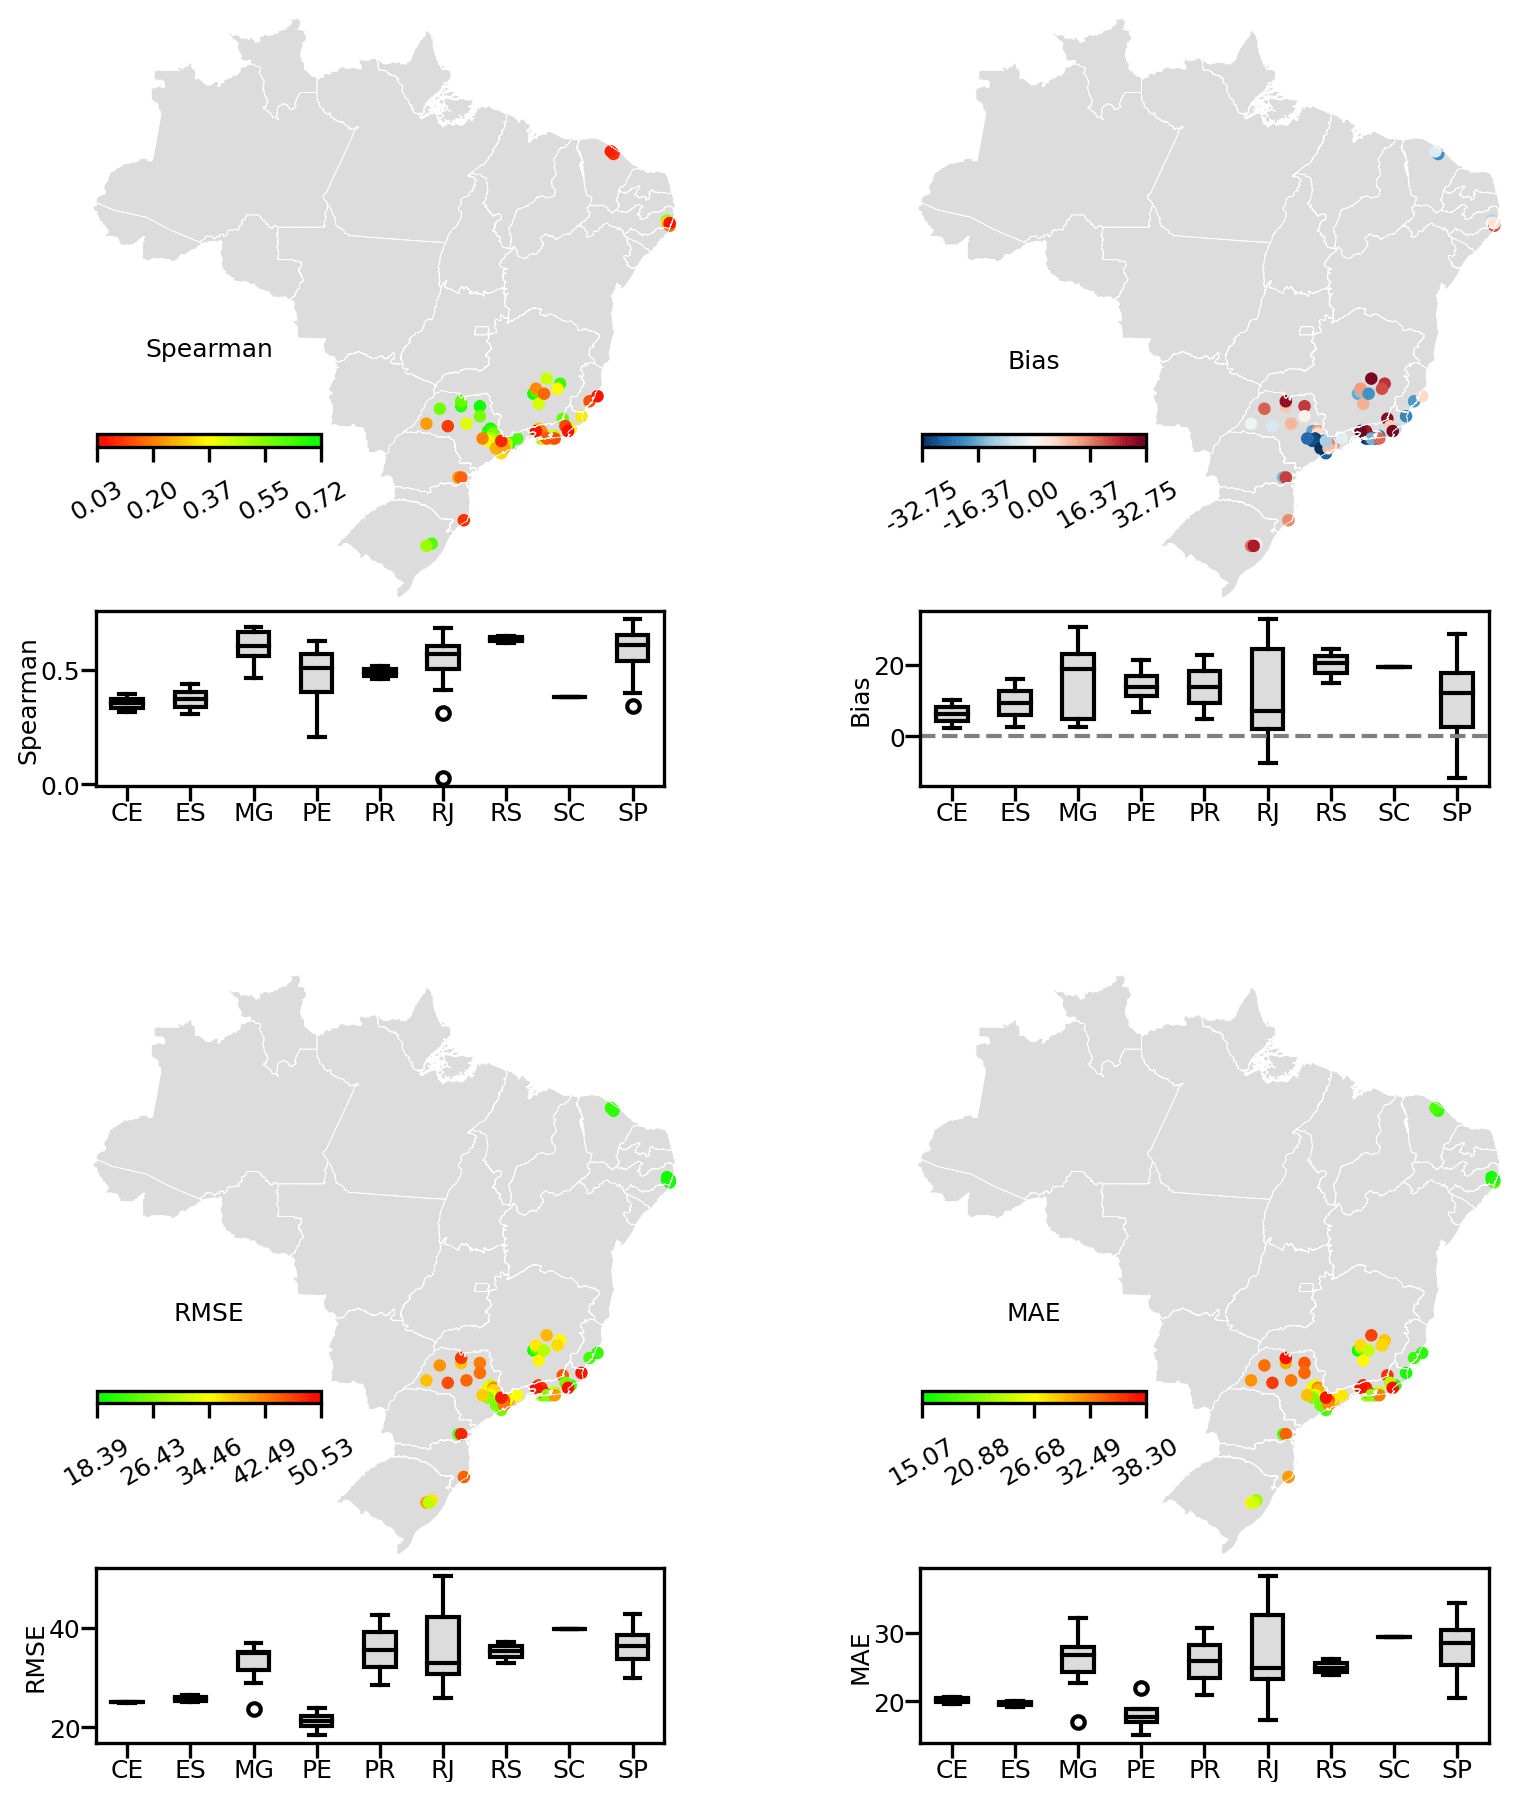
Figure 4Spearman rank, bias, root mean squared error (RMSE), and mean absolute error (MAE) of O3 dataset of BRAIN vs. observed values. Box plots of statistical metric by Brazilian state (considering only states with monitoring stations with representative data in 2019).
2.2 Meteorology
The WRF model has been used in this work to produce inputs for CMAQ and for meteorology characterization in Brazil. We provide hourly simulations in netCDF files. WRF has been set up to reproduce 36 h simulations, where the initial 12 h have been dedicated to model stabilization; these are excluded from the analysis. Thirty-three vertical levels have been employed, spaced at 50 hPa intervals. The parameterizations used in this work are described in Sect. S3. The remaining vertical levels followed a hybrid modeling scheme, accounting for terrain in the lower layers and gradually minimizing its influence at the higher levels. Details of WRF outputs can be found in Sect. S4 (Table S2).
The Global Forecast System (GFS) from the National Center for Atmospheric Research (NCAR) provided inputs with a spatial resolution of 0.25° × 0.25° and a temporal resolution of 6 h for the WRF simulations (Skamarock et al., 2008). Land use data and classification parameters are from the United States Geological Survey's (USGS) Moderate Resolution Imaging Spectroradiometer (MODIS).
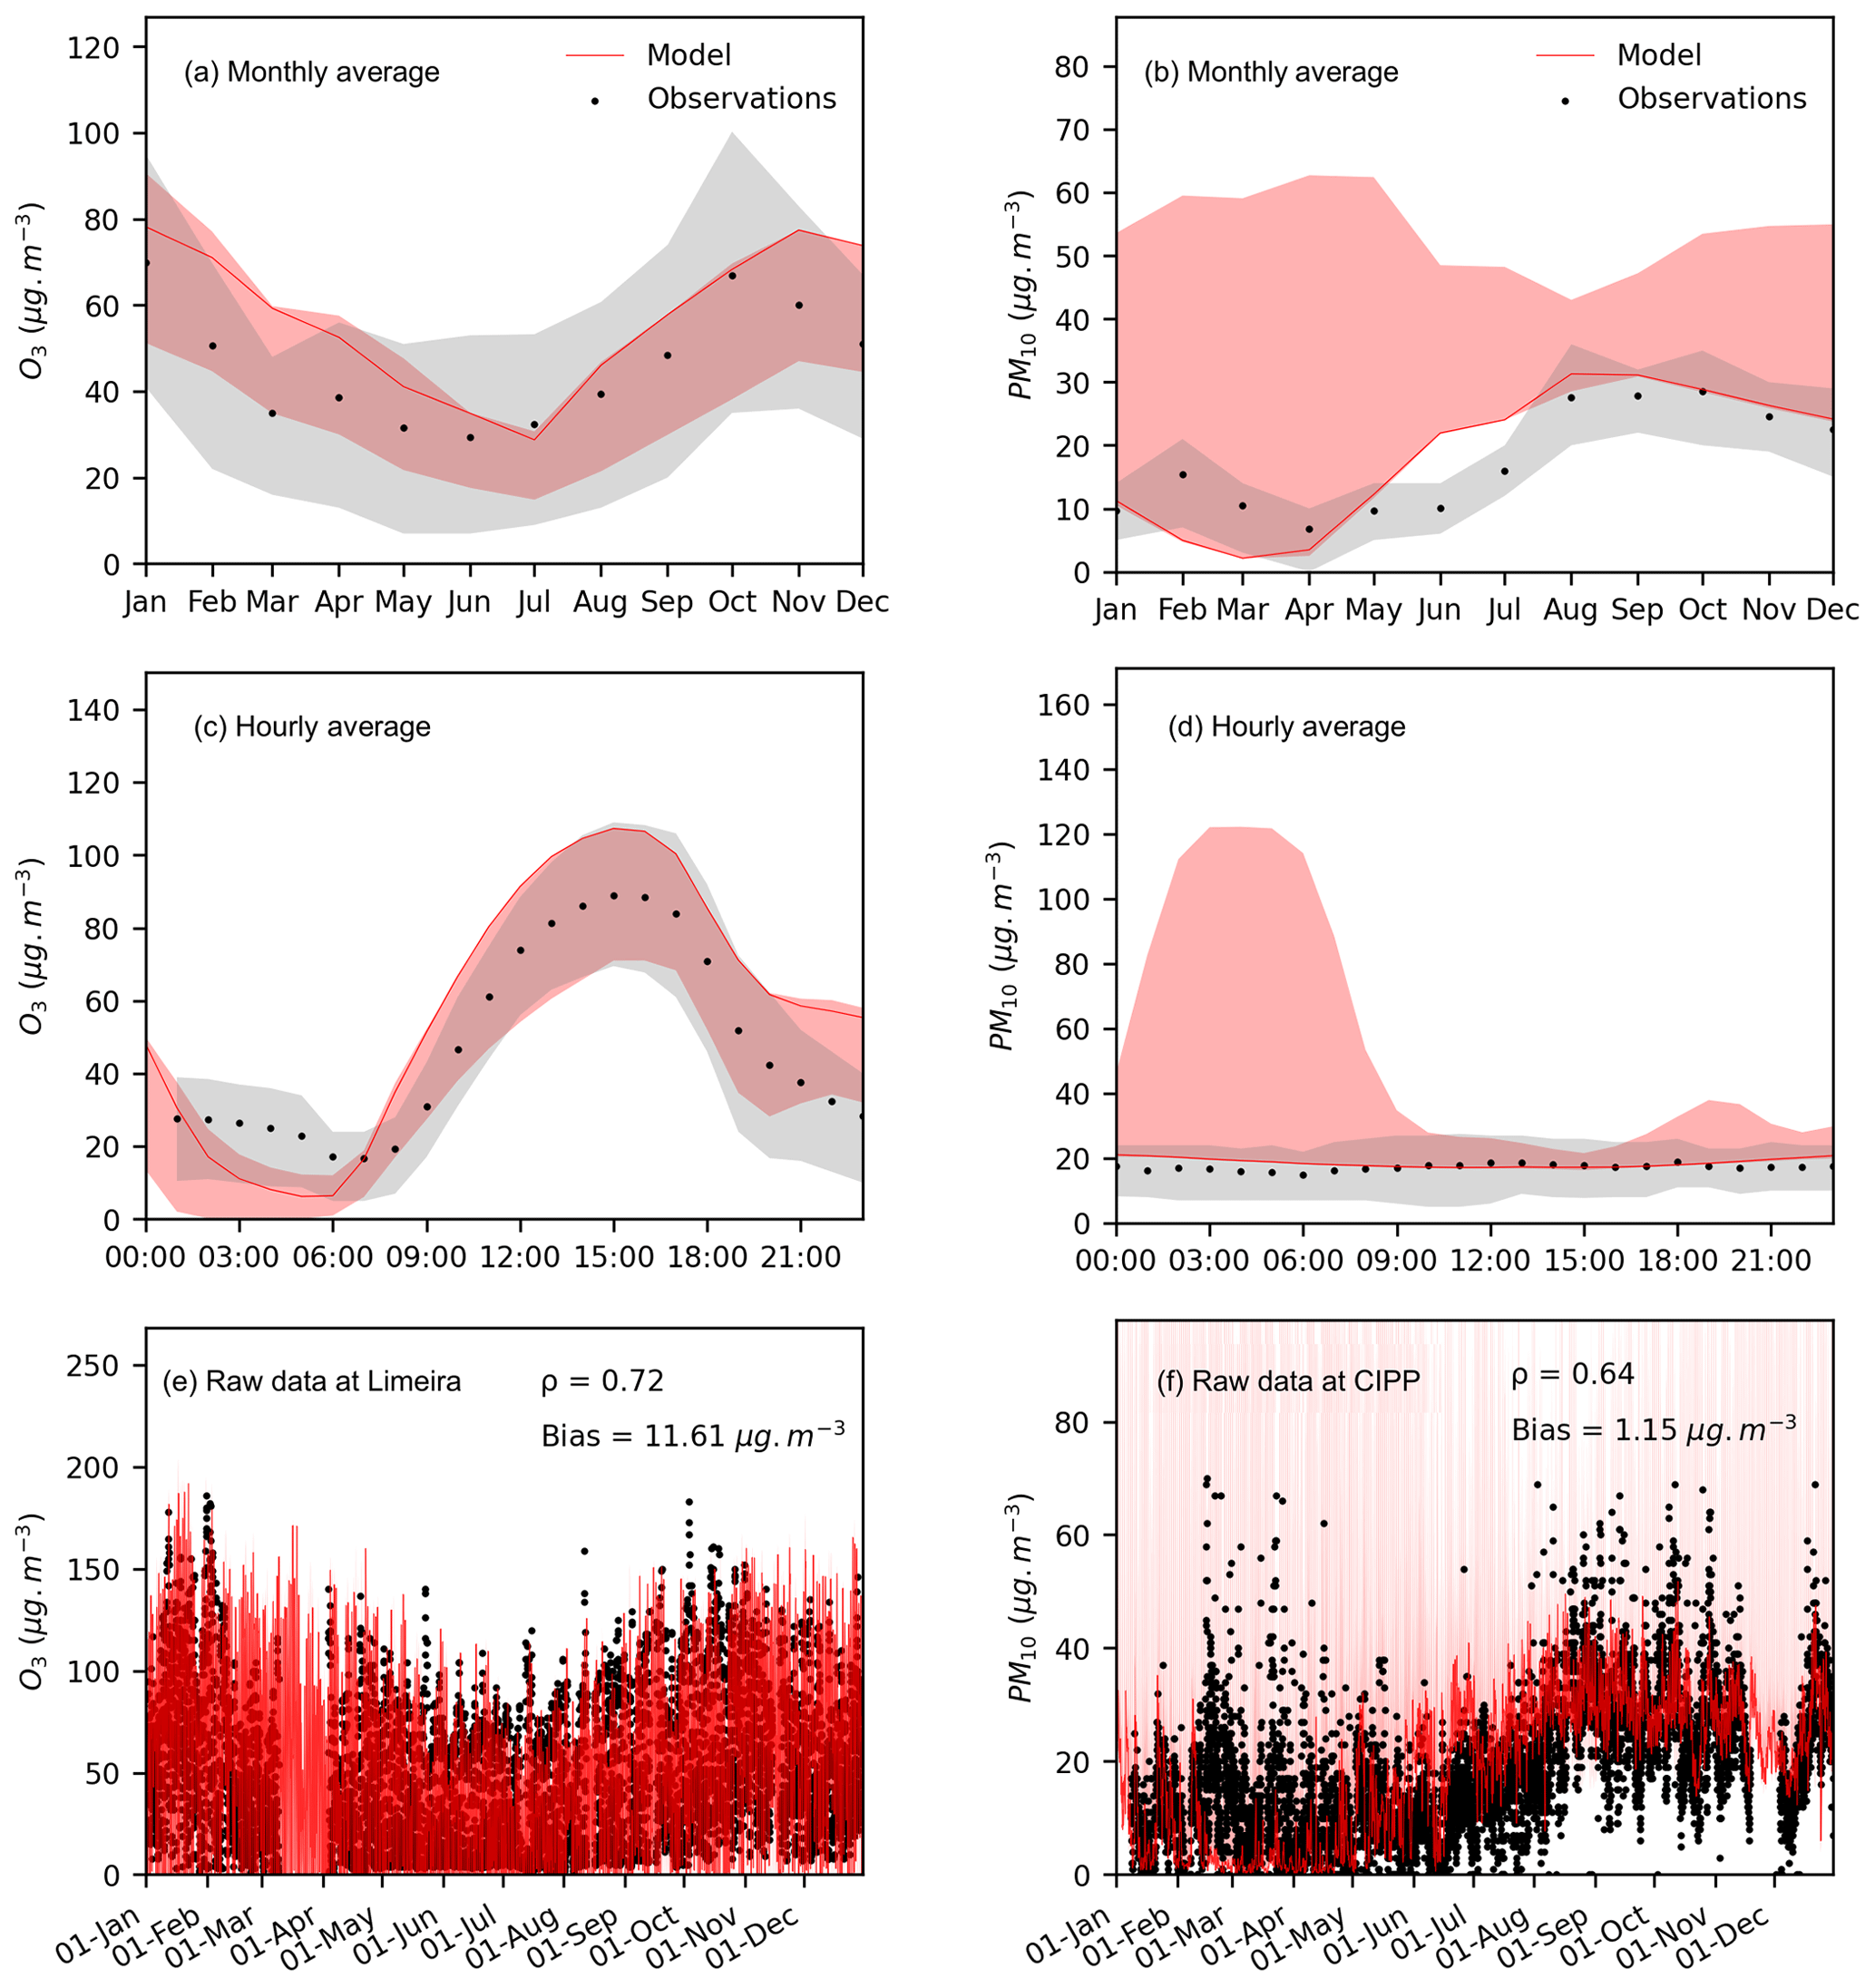
Figure 5Time series of O3 and PM10 modeled and measured at Limeira (a, c, e) and CIPP (b, d, f) monitoring stations.
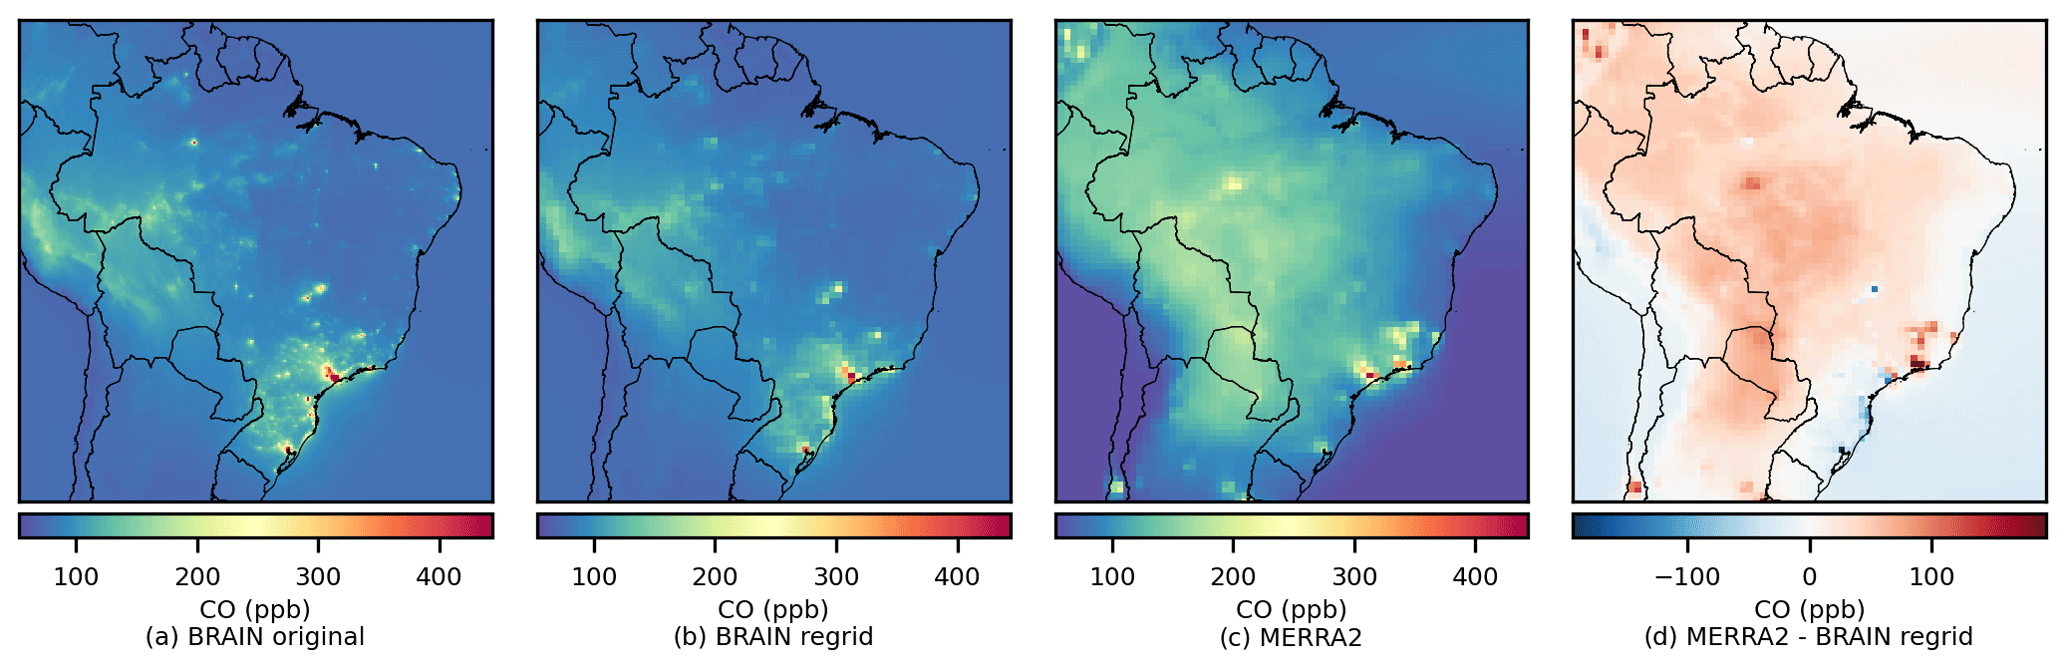
Figure 6Annual average concentration of CO from BRAIN with its original resolution (a), from BRAIN regridded to MERRA-2 resolution (b), and from MERRA-2 (c) and the difference between MERRA-2 and BRAIN (d).
The Brazilian regions (north, northeast, midwest, southeast, and south) encompass three distinct climatic zones, namely the equatorial, tropical, and subtropical zones. The climatic diversity in Brazil is also shaped by topographical variations, landscape or vegetation, and the coastal areas. The temperature in Brazil follows a latitudinal pattern, increasing from south to north (Fig. 2e). The highest average temperatures are observed in the Amazon region, matching the historic data (Cavalcanti, 2016). The southern region exhibits the lowest average temperatures, which is also consistent with historical data (Cavalcanti, 2016).
The highest values of atmospheric pressure occurred in the northern region and in the extreme south of the country, and the lowest values were between the southeastern and southern regions (Fig. 2a). The planetary boundary layer height (PBLH) reaches the highest levels in the northeastern region and the lowest levels at the southern and southeastern coasts (Fig. 2b). The highest values of wind speed occurred in part of the northern and southern region. The Amazon region presented the lowest values of surface wind speed (Fig. 2f).
Humidity and precipitation exhibit similar patterns in the northern and northeastern regions (Fig. 2c, d) due to the trade winds that transport moisture from the tropical Atlantic (Mendonça and Danni-Oliveira, 2017). Except for the coast, the northeastern region is characterized by low humidity and drought during half of the year. The southern and southeastern regions have well-distributed rainfall throughout the year, as well as intermediate levels of humidity, except for the northern coast of the southern region, which has an elevated level of precipitation and humidity throughout the year.
The WRF model demonstrated the ability to reproduce diurnal and seasonal variability in winds in the Brazilian northeastern region (Souza et al., 2022a), although it underestimated the height of the planetary boundary layer (PBLH) by up to 20 %, as well as the temperature and humidity at 4 °C and 15 %, respectively. Pedruzzi et al. (2022) tested several model configurations, including an alternative land use scheme, and found a WRF tendency to overestimate temperature and humidity in the Brazilian southeastern region. Macedo et al. (2016) also evaluated the model's ability to predict extreme precipitation events. Although the WRF reasonably predicts the main meteorological aspects of the Brazilian southern region, the precipitation extremes were underestimated. A wind mapping study (Souza et al., 2022b) using WRF indicated that the average errors presented by the model in Brazil are minor, with an average bias of 2 m s−1 at 200 m in terms of wind intensity and errors at temperatures of 2 °C and humidity of approximately 10 %. Winds at lower levels tended to be overestimated, whereas PBLH was generally underestimated during the day.
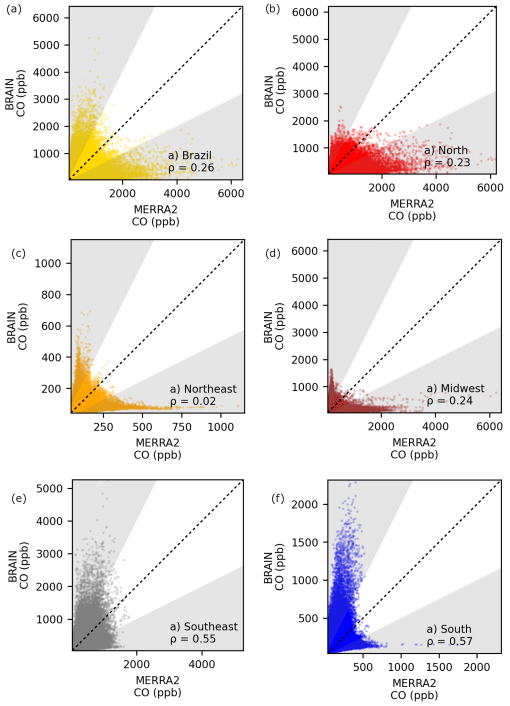
Figure 7Concentration of CO from BRAIN vs. MERRA-2 in Brazil (a), northern Brazil (b), northeastern Brazil (c), midwestern Brazil (d), southeastern Brazil (e), and southern Brazil (f).
2.3 Air quality
We coupled emissions inventories, WRF, and CMAQ to produce the BRAIN air quality dataset for Brazil. CMAQ version 5.3.2 was set up using the third version of the Carbon Bond 6 chemical mechanism (cb6r3_ae7_aq) (Yarwood et al., 2010; Emery et al., 2015) with AERO7 treatment of secondary organic aerosol for standard cloud chemistry (Appel et al., 2021). The other model configurations used in this work can be found in Sect. S5 and at https://github.com/leohoinaski/CMAQrunner (last access: 8 May 2024). The pollutant list in CMAQ outputs, containing 216 species, can be found in Sect. S6 (Table S3).
The CMAQ standard profile of boundary conditions is used in the larger domain (d01), which provides the boundary conditions for the smaller one (d02). Further improvements to the database could include the boundary conditions derived from the GEOS-Chem model (Bey et al., 2001) (https://geoschem.github.io/, last access: 8 May 2024) or other better alternatives for the largest domain. The simulations have 24 h length and a time step interval of 1 h. The last hour of the previous simulation has been set up as the initial condition of the next one. We used the standard profile for the first hour of the first simulation (00:00:00 GMT on 1 January 2019). The figures with the spatial distribution and violations of criteria pollutants can be found in Sect. S7. Section S8 also presents the time series of criteria pollutants in Brazilian cities.
Using the BRAIN air quality dataset, we can observe the highest concentrations of NO2 (Fig. 3a–b), O3 (Fig. 3c–d), and PM10 (Fig. 3e–f) in southeastern and southern Brazil. The concentration of O3 violates the World Health Organization (WHO) air quality standards in multiple locations all over the country, while for NO2 and PM10, this occurred mostly in southeastern and southern Brazil.
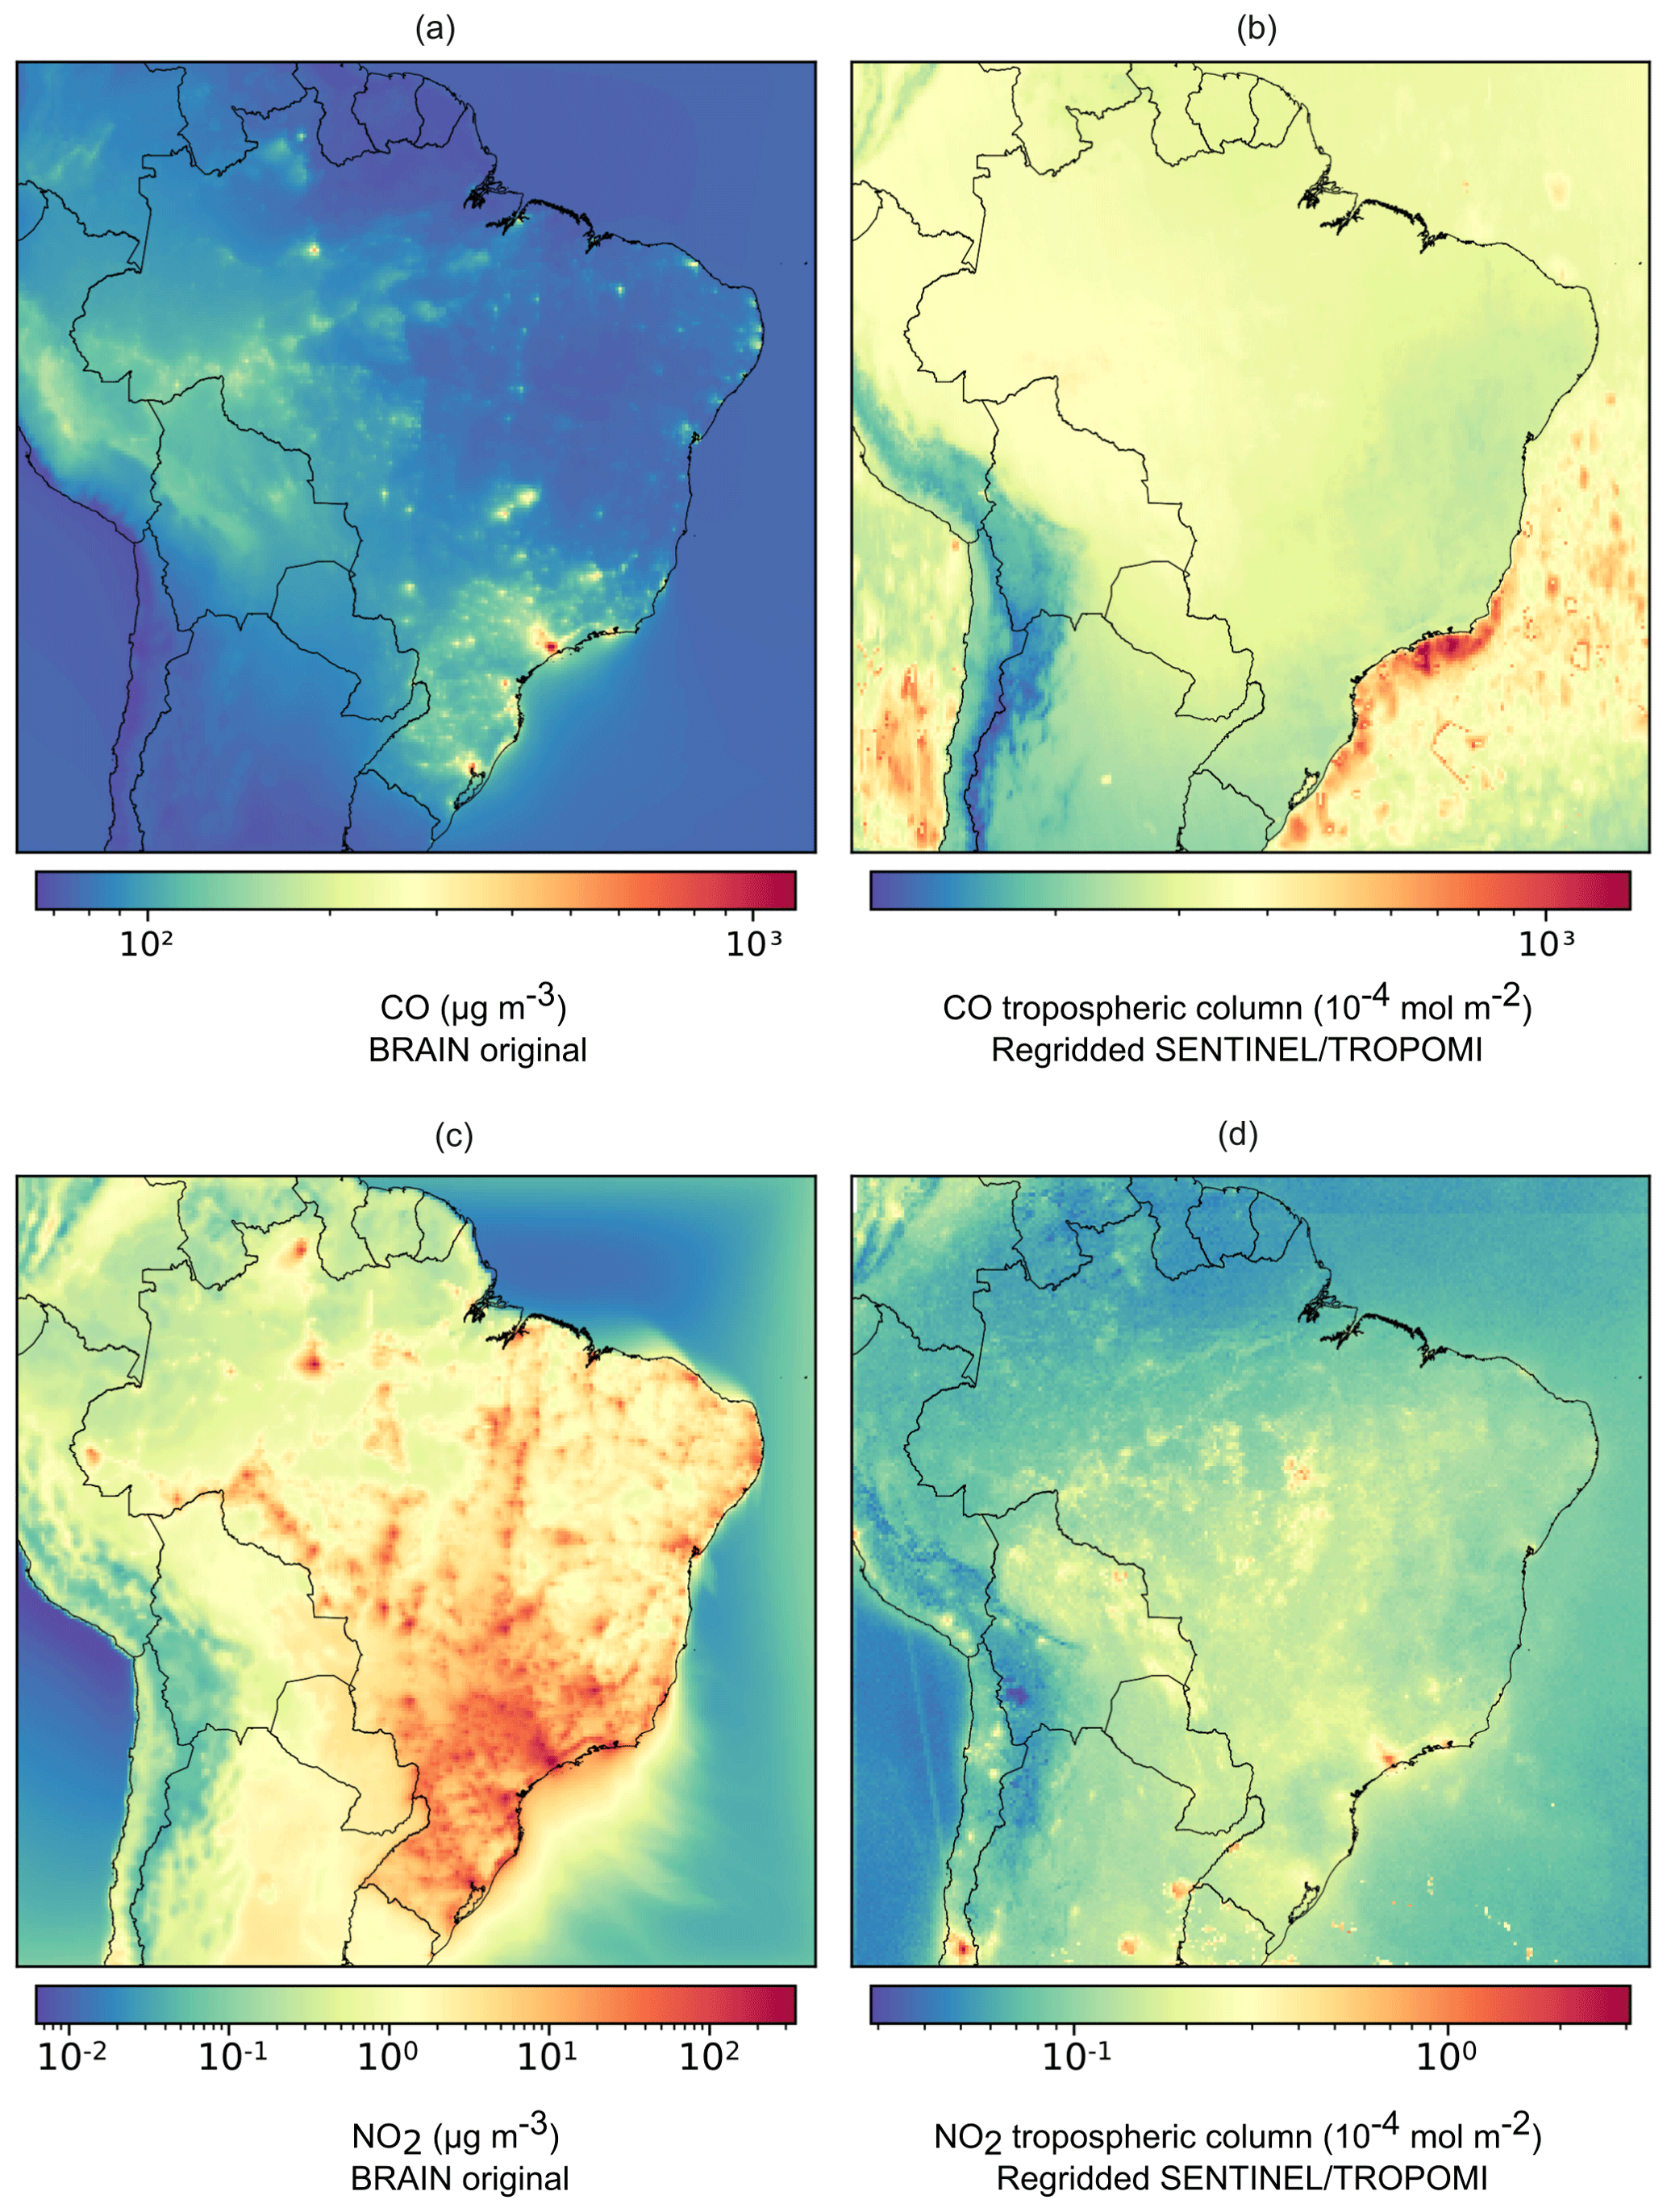
Figure 8Annual average concentration of CO and NO2 from BRAIN at its original resolution (a, c) and from Sentinel-5P TROPOMI spatially aligned to the BRAIN resolution (b, d).
2.3.1 Models' performance
We sampled pixels around the monitoring station using a buffer of 0.5° to calculate the Spearman rank, bias, root mean squared error (RMSE), and mean absolute error (MAE) of the sampled pixels. We selected the highest Spearman rank of each pixel to demonstrate the model's performance in Figs. 4 and 5. Section S10 presents the box plots with overall statistical metrics for all stations. Section S11 presents statistical metrics by means of a monitoring station and pollutant, considering the pixel with the highest Spearman rank around each monitoring station. Section S12 presents the scatter plots comparing the BRAIN air quality dataset and the observations of each monitoring station. We used the simulations with domain d01 in the statistical analysis.
We observed the highest Spearman rank (0.72) in the state of São Paulo for O3 concentration. Bias analysis revealed an underestimation in the São Paulo metropolitan area, while an overestimation occurred in Minas Gerais, Santa Catarina, Rio Grande do Sul, and the interior of São Paulo. In the northeast and in the state of Espírito Santo, bias is closer to zero. In Rio de Janeiro, the model over- and underestimated the observations. Regarding RMSE and MAE, the model performed better in coastal areas (maps in Fig. 4).
Comparing the states with air quality monitoring stations, the Spearman correlation of the O3 dataset of BRAIN is higher in São Paulo, Minas Gerais, and Rio de Janeiro. However, these states also have a higher range of bias values, which could be negative and positive in São Paulo and Rio de Janeiro and are only positive in Minas Gerais (box plots in Fig. 4).
The heterogeneity in the stations' types and the insufficient spatial representativeness of observations in the Brazilian states must be considered while evaluating the model performance. According to the IEMA (2022), the strategic planning for the implementation of air quality monitoring stations, the financing and political efforts, and the technical characteristics (from installation to calibration and maintenance) vary significantly between Brazilian states. The lack of data quality assurance may compromise the credibility of the available air quality observations in Brazil.
BRAIN reproduced well the concentrations in moderately urbanized areas, such as Limeira and Piracicaba (Sect. S12). The database reached moderate performance in highly urbanized areas such as Copacabana and Rio de Janeiro (RJ) and at Marginal Tietê in the megacity of São Paulo (Sect. S12). Regarding the temporal profiles of O3 and PM10, the seasonal and daily profiles are captured for both modeled pollutants, showing a suitable fit with the observations at the Limeira and Pecém Industrial and Port Complex (CIPP) air quality monitoring stations (Fig. 5). This reveals that the database can capture temporal patterns of air pollutant concentrations in urbanized and industrialized areas.
Figures with statistical metrics for other pollutants can be found in Sect. S13. Figures of modeled and observed time series for all monitoring stations can be found in Sect. S14.
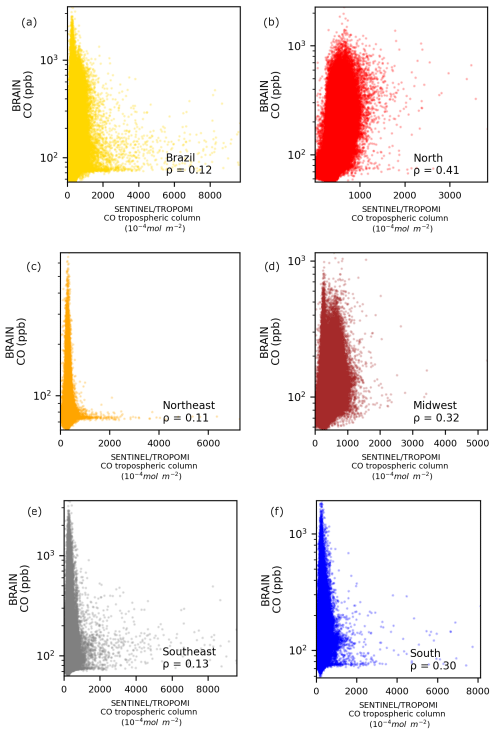
Figure 9Concentration of CO from BRAIN vs. Sentinel-5P TROPOMI in Brazil (a), northern Brazil (b), northeastern Brazil (c), midwestern Brazil (d), southeastern Brazil (e), and southern Brazil (f).
Overall, the average concentrations are well simulated by CMAQ in BRAIN, with fair to good correlations (up to ∼ 0.7) between modeling and local measurements in São Paulo. Similar results have been reported by Albuquerque et al. (2018). Kitagawa et al. (2021) simulated PM2.5 in a Brazilian coastal–urban area and showed that the CMAQ results commonly overestimated the observations, which agrees with the BRAIN air quality dataset. In another comparison between observations and CMAQ simulations (Kitagawa et al., 2022), the model overestimated the PM and NO2 concentrations in the metropolitan region of Vitória (MRV) and underestimated O3. The authors suggest that the CMAQ simulations are suitable over the MRV, even though the model could not capture some local variabilities in air pollutant concentrations. It is already reported that the short-time abrupt variations are difficult to reproduce by means of air quality models (Albuquerque et al., 2018). The complex task of predicting air quality is associated with multiple error factors, including the lack of an emissions inventory, meteorology parameterizations, initial and boundary conditions, chemical mechanisms, numerical routines, etc. (Cheng et al., 2019; Albuquerque et al., 2018; Park et al., 2006; Pedruzzi et al., 2019).
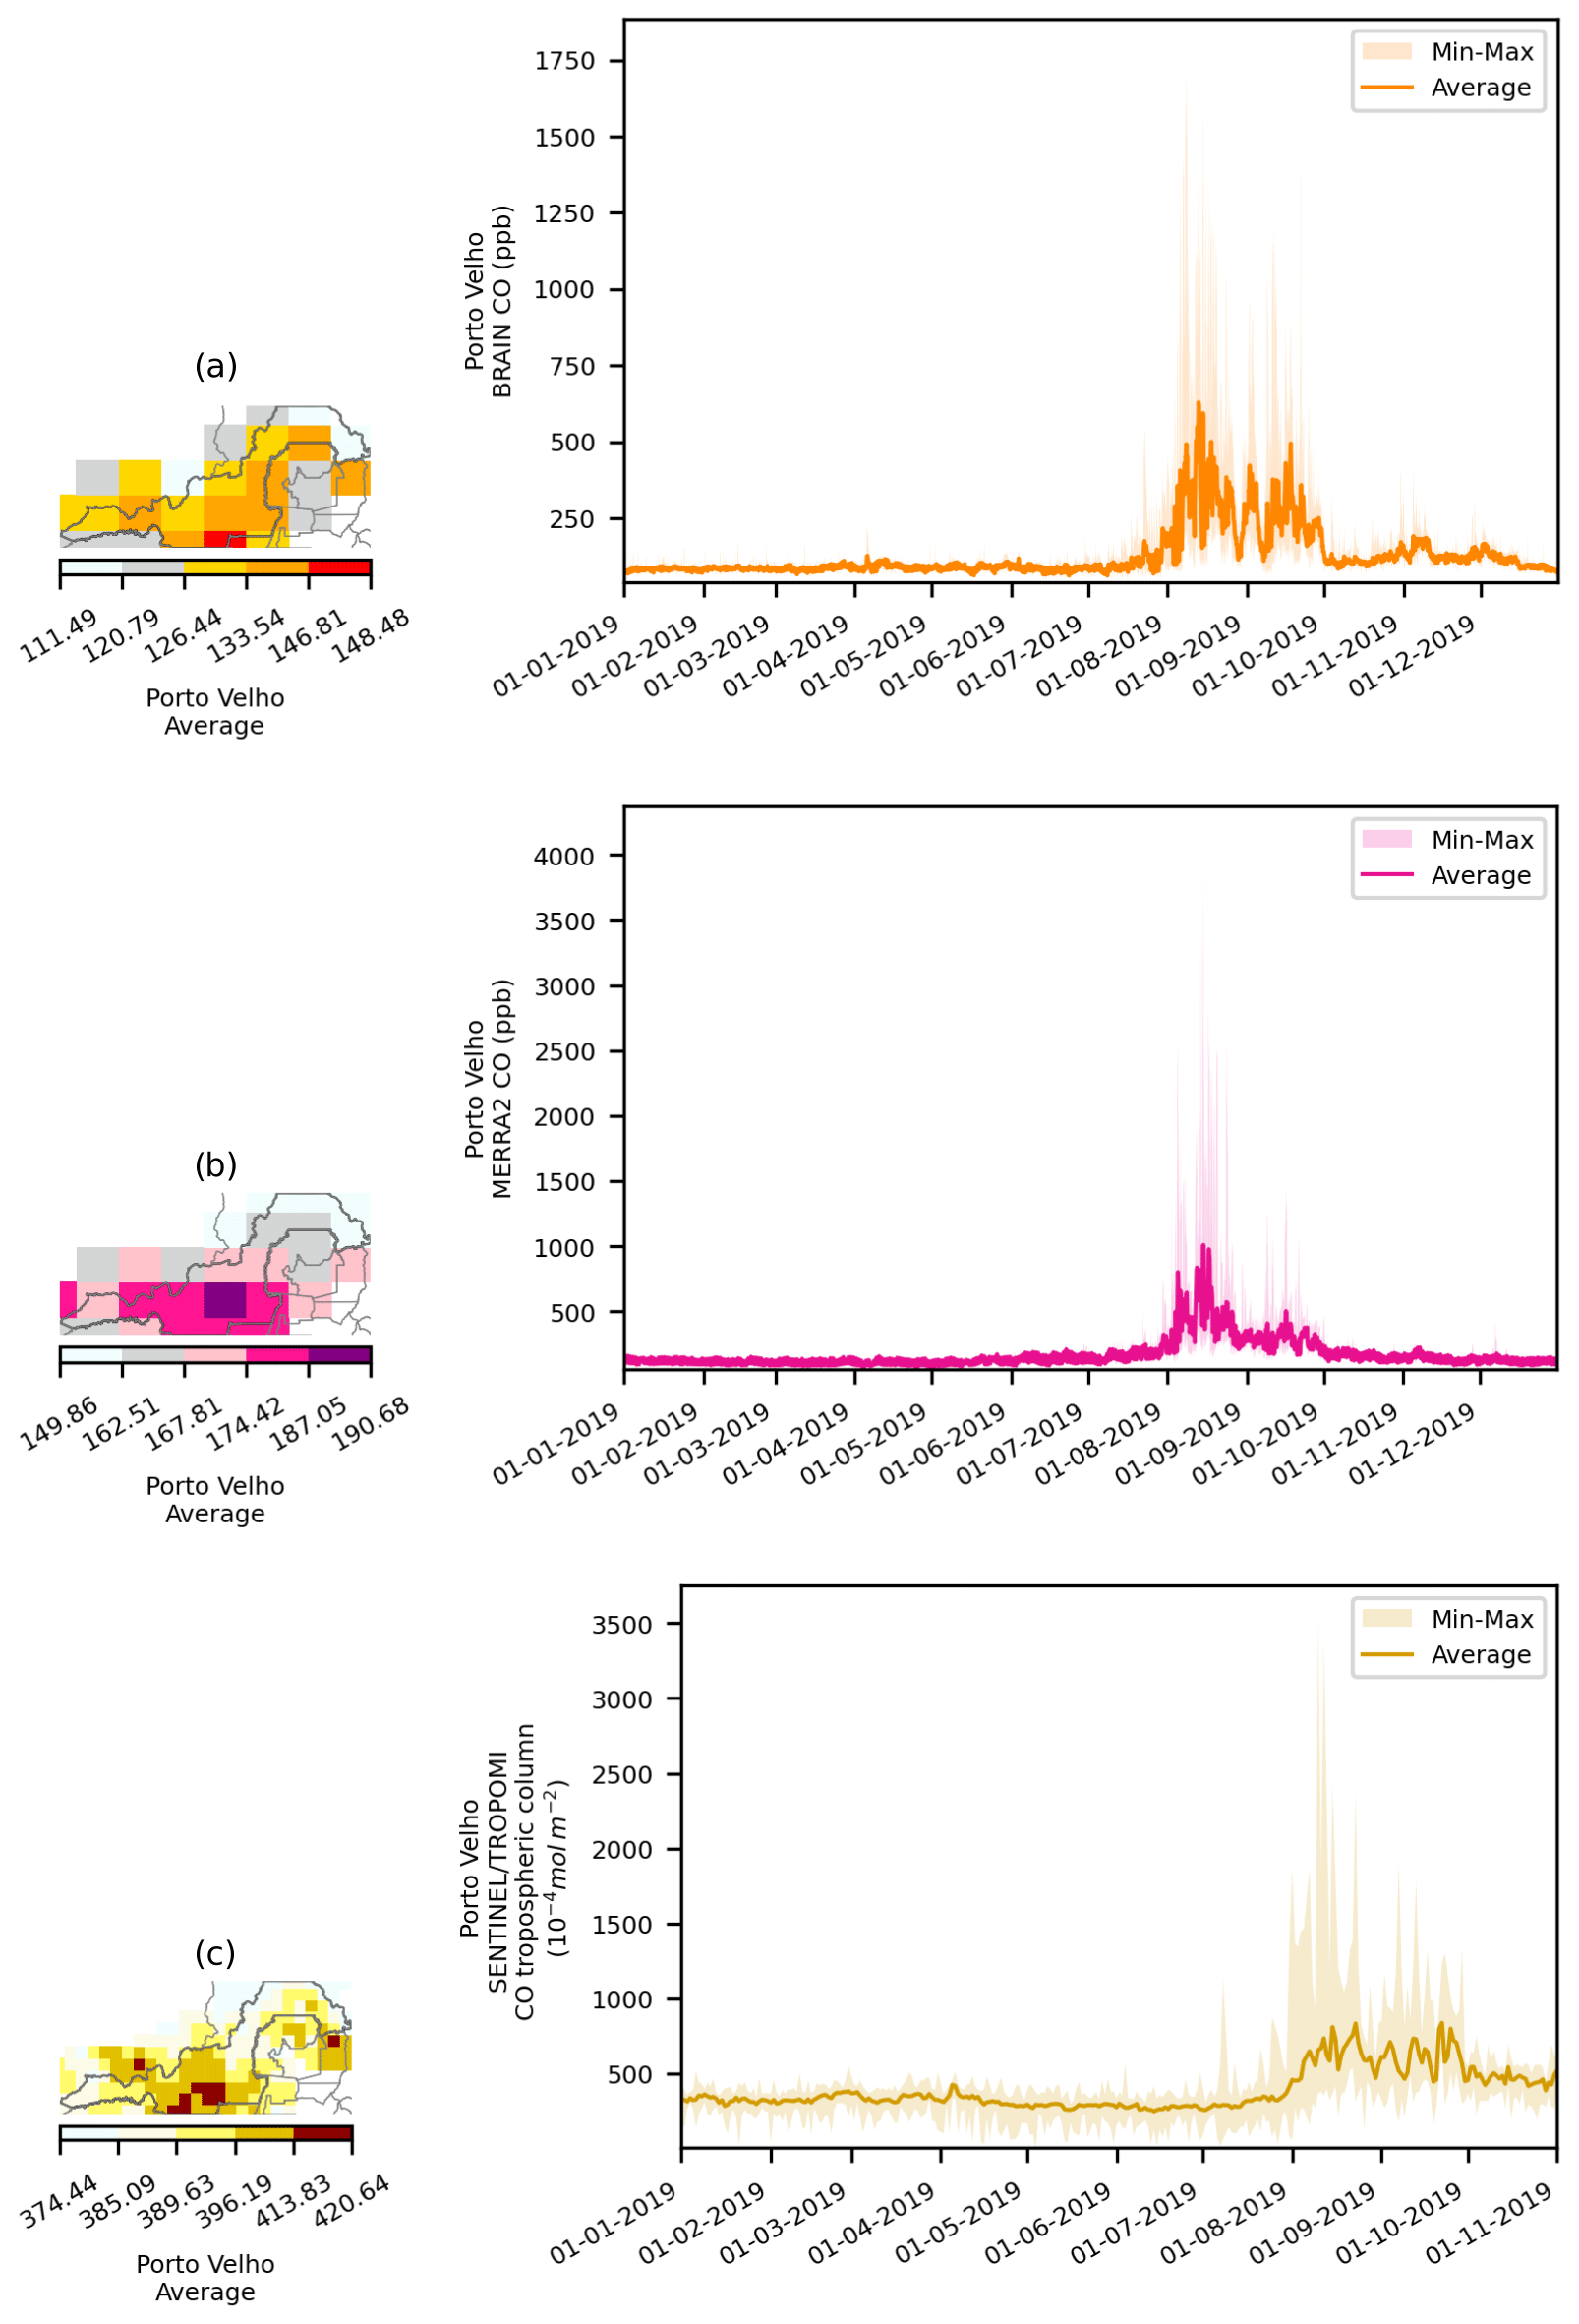
Figure 10Annual average and hourly time series of CO from BRAIN (a), MERRA-2 (b), and Sentinel-5P TROPOMI (daily averages) (c) in Porto Velho, Brazil.
We analyzed the performances of 4×4 km simulations for CO, NO2, O3, and SO2, drawing a buffer of 0.5° degrees around monitoring station positions in southern Brazil. Our findings indicated higher Spearman values for the spatial resolution of 20×20 km for CO, O3, and SO2. Specifically, for O3, the best result at 20×20 km was 0.76, whereas the same point at 4×4 km resolution showed a correlation of 0.46. This pattern was also observed for CO, with the best result at 20×20 km being a Spearman value of 0.47 and 0.23 at the same point at 4×4 km resolution. The smallest differences in Spearman rank were observed for SO2 (0.22: 20×20, 0.19: 4×4). Even though improving the spatial resolution did not increase the correlation with measured data, we found the best results for bias, RMSE, and MAE for almost all pollutants at a 4×4 km resolution, except for CO. Please refer to Sect. S15 for the complete statistical analysis of 4×4 km simulations.
BRAIN captures seasonal patterns and the absolute magnitude of PM2.5 in the northwest of the Amazonas state (near the Amazon Tall Tower Observatory – ATTO), as presented by Artaxo et al. (2013). This shows that our database can reproduce the concentrations in background areas (far from highly urbanized centers). Comparing BRAIN with observations at heavily biomass-burning-impacted sites in southwestern Amazonia (Porto Velho) (Artaxo et al., 2013) revealed that BRAIN can capture seasonal variations caused by wet and dry seasons, as well as the magnitude of average and peak concentrations. However, BRAIN PM2.5 estimates are closer to the coarse mode of the time series rather than the fine mode shown in Artaxo et al. (2013). Even though BRAIN has captured the O3 pattern observed by Artaxo et al. (2013), the estimates are around 2.7 times higher than the observations in the dry season and a factor of 2 higher for the wet season. It is worth mentioning that BRAIN uses 2019 data, while the study by Artaxo et al. (2013) consists of a sampling campaign from 2008 to 2012.
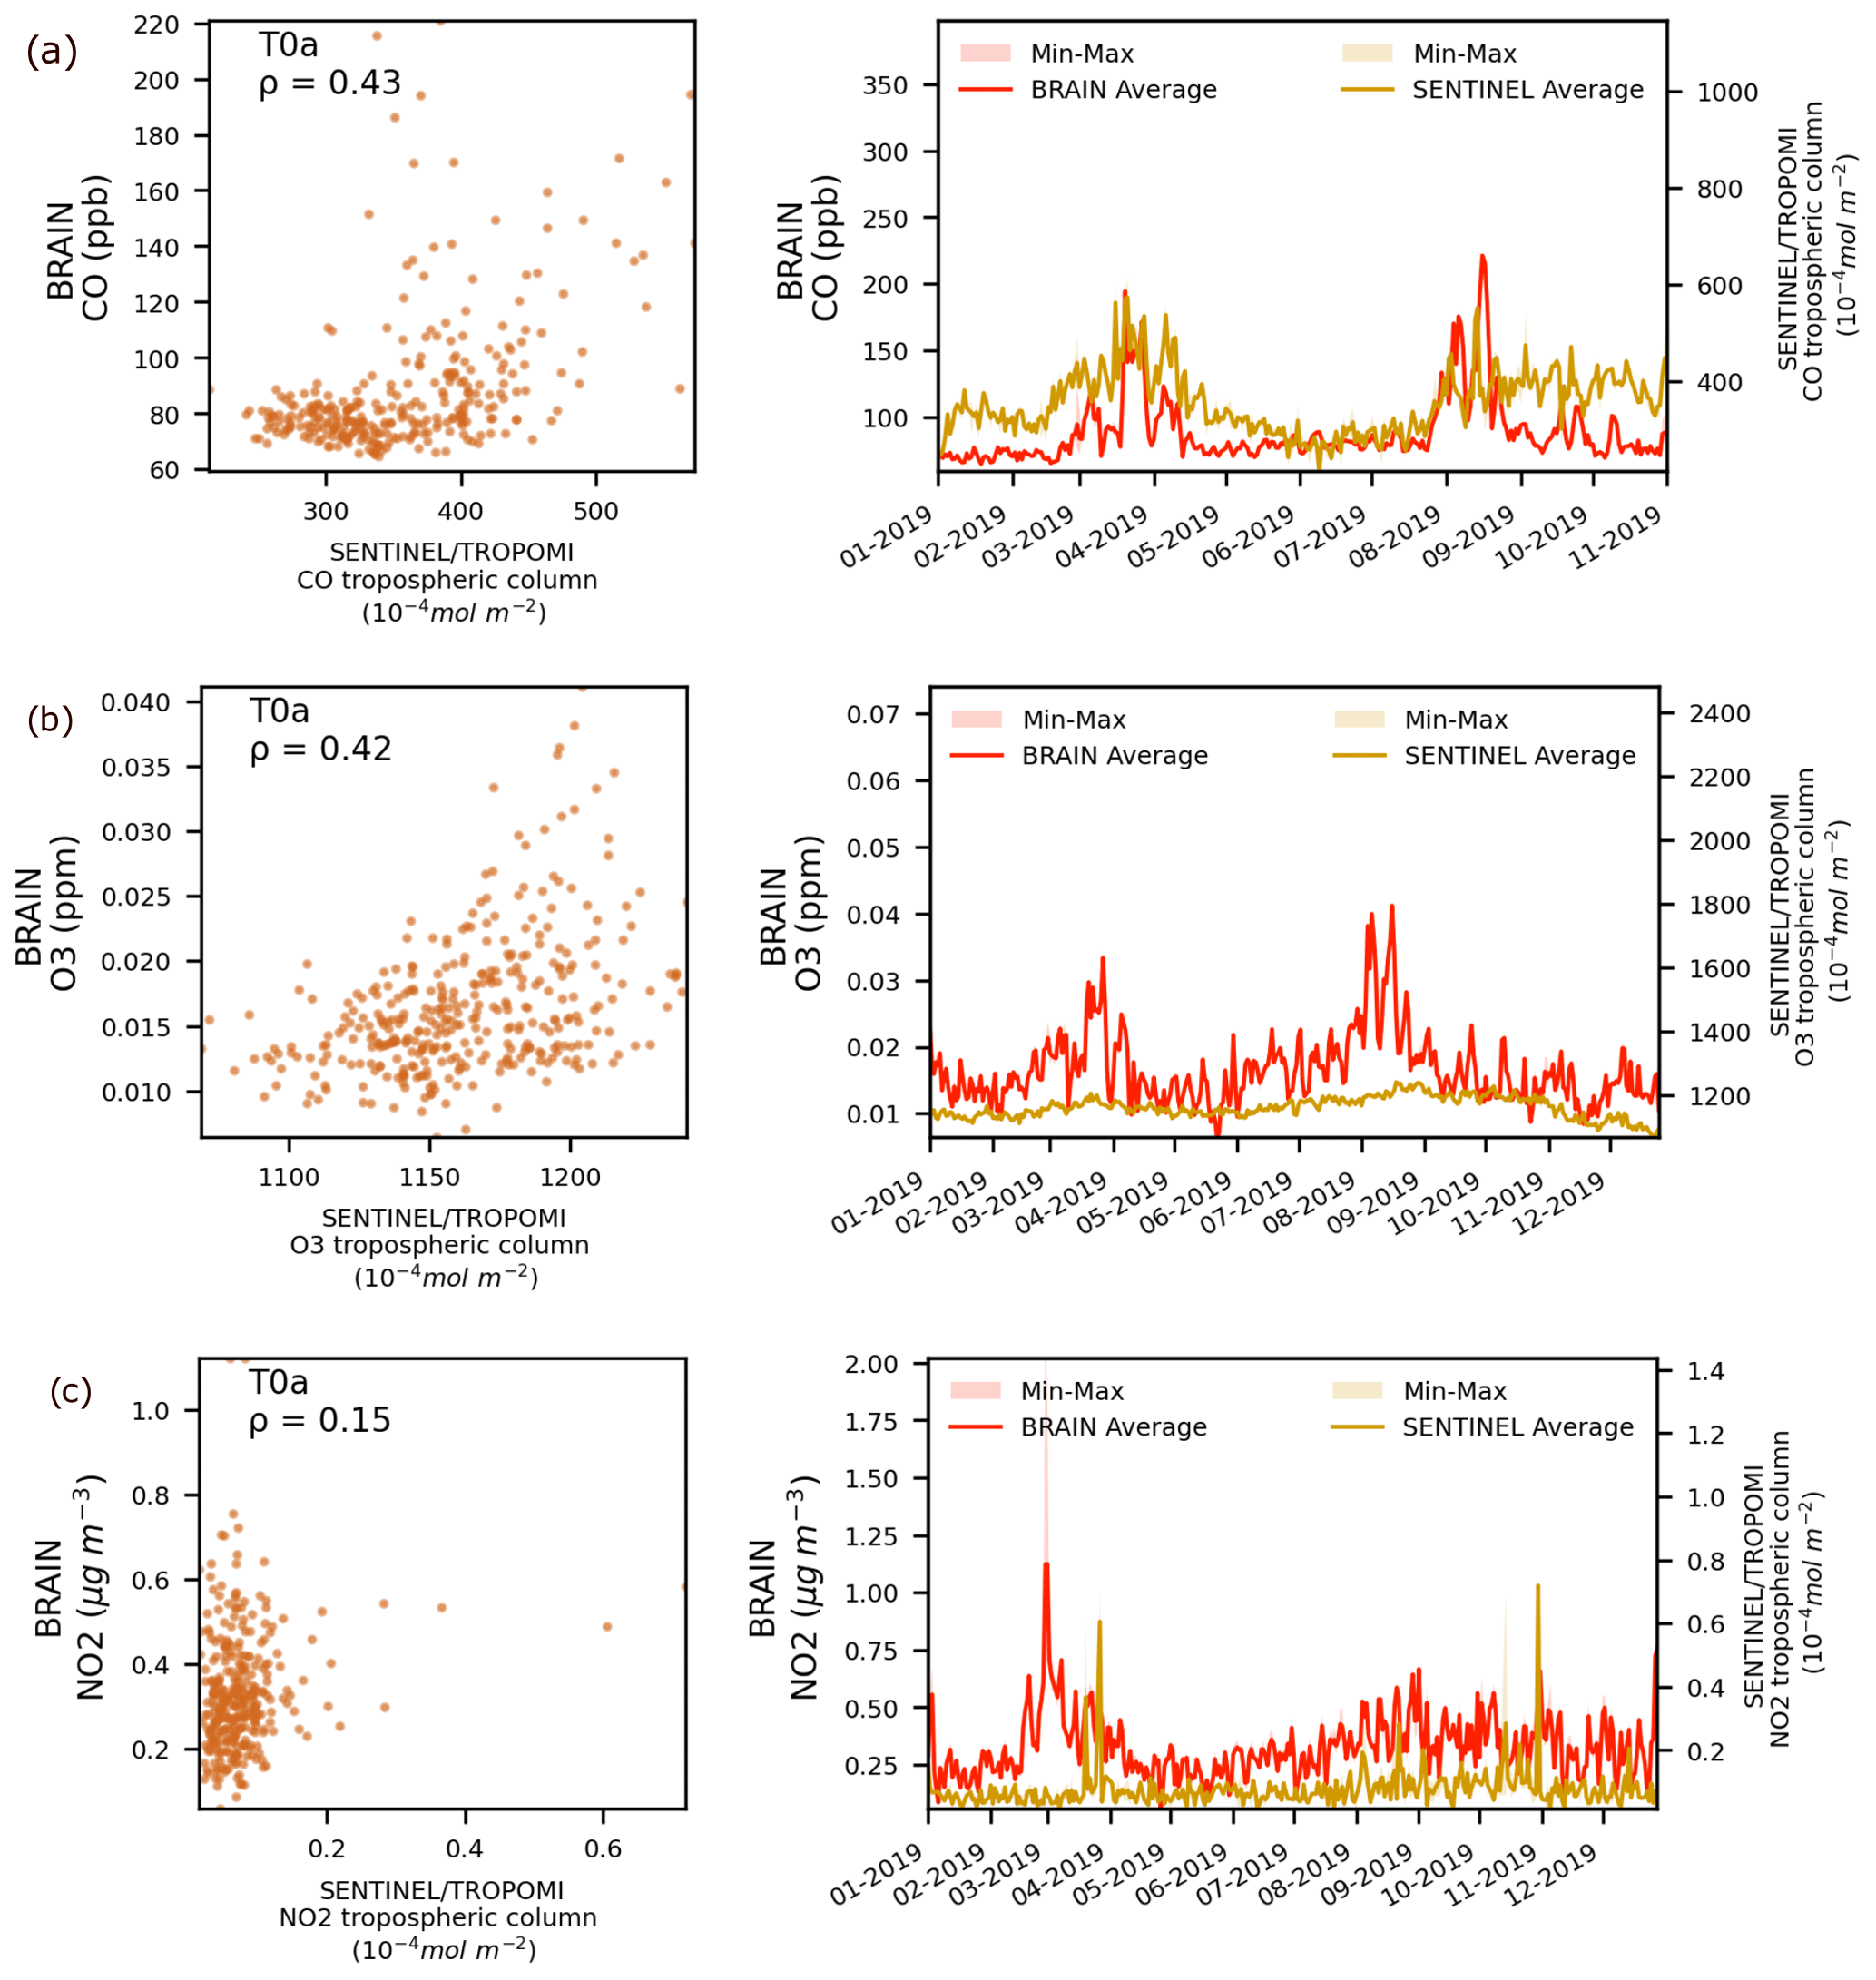
Figure 11Scatter plot and daily time series of CO (a), O3 (b), and NO2 (c) from BRAIN and Sentinel-5P TROPOMI at T0a (GoAmazon reference). Values extracted using a buffer of 0.2° around the site.
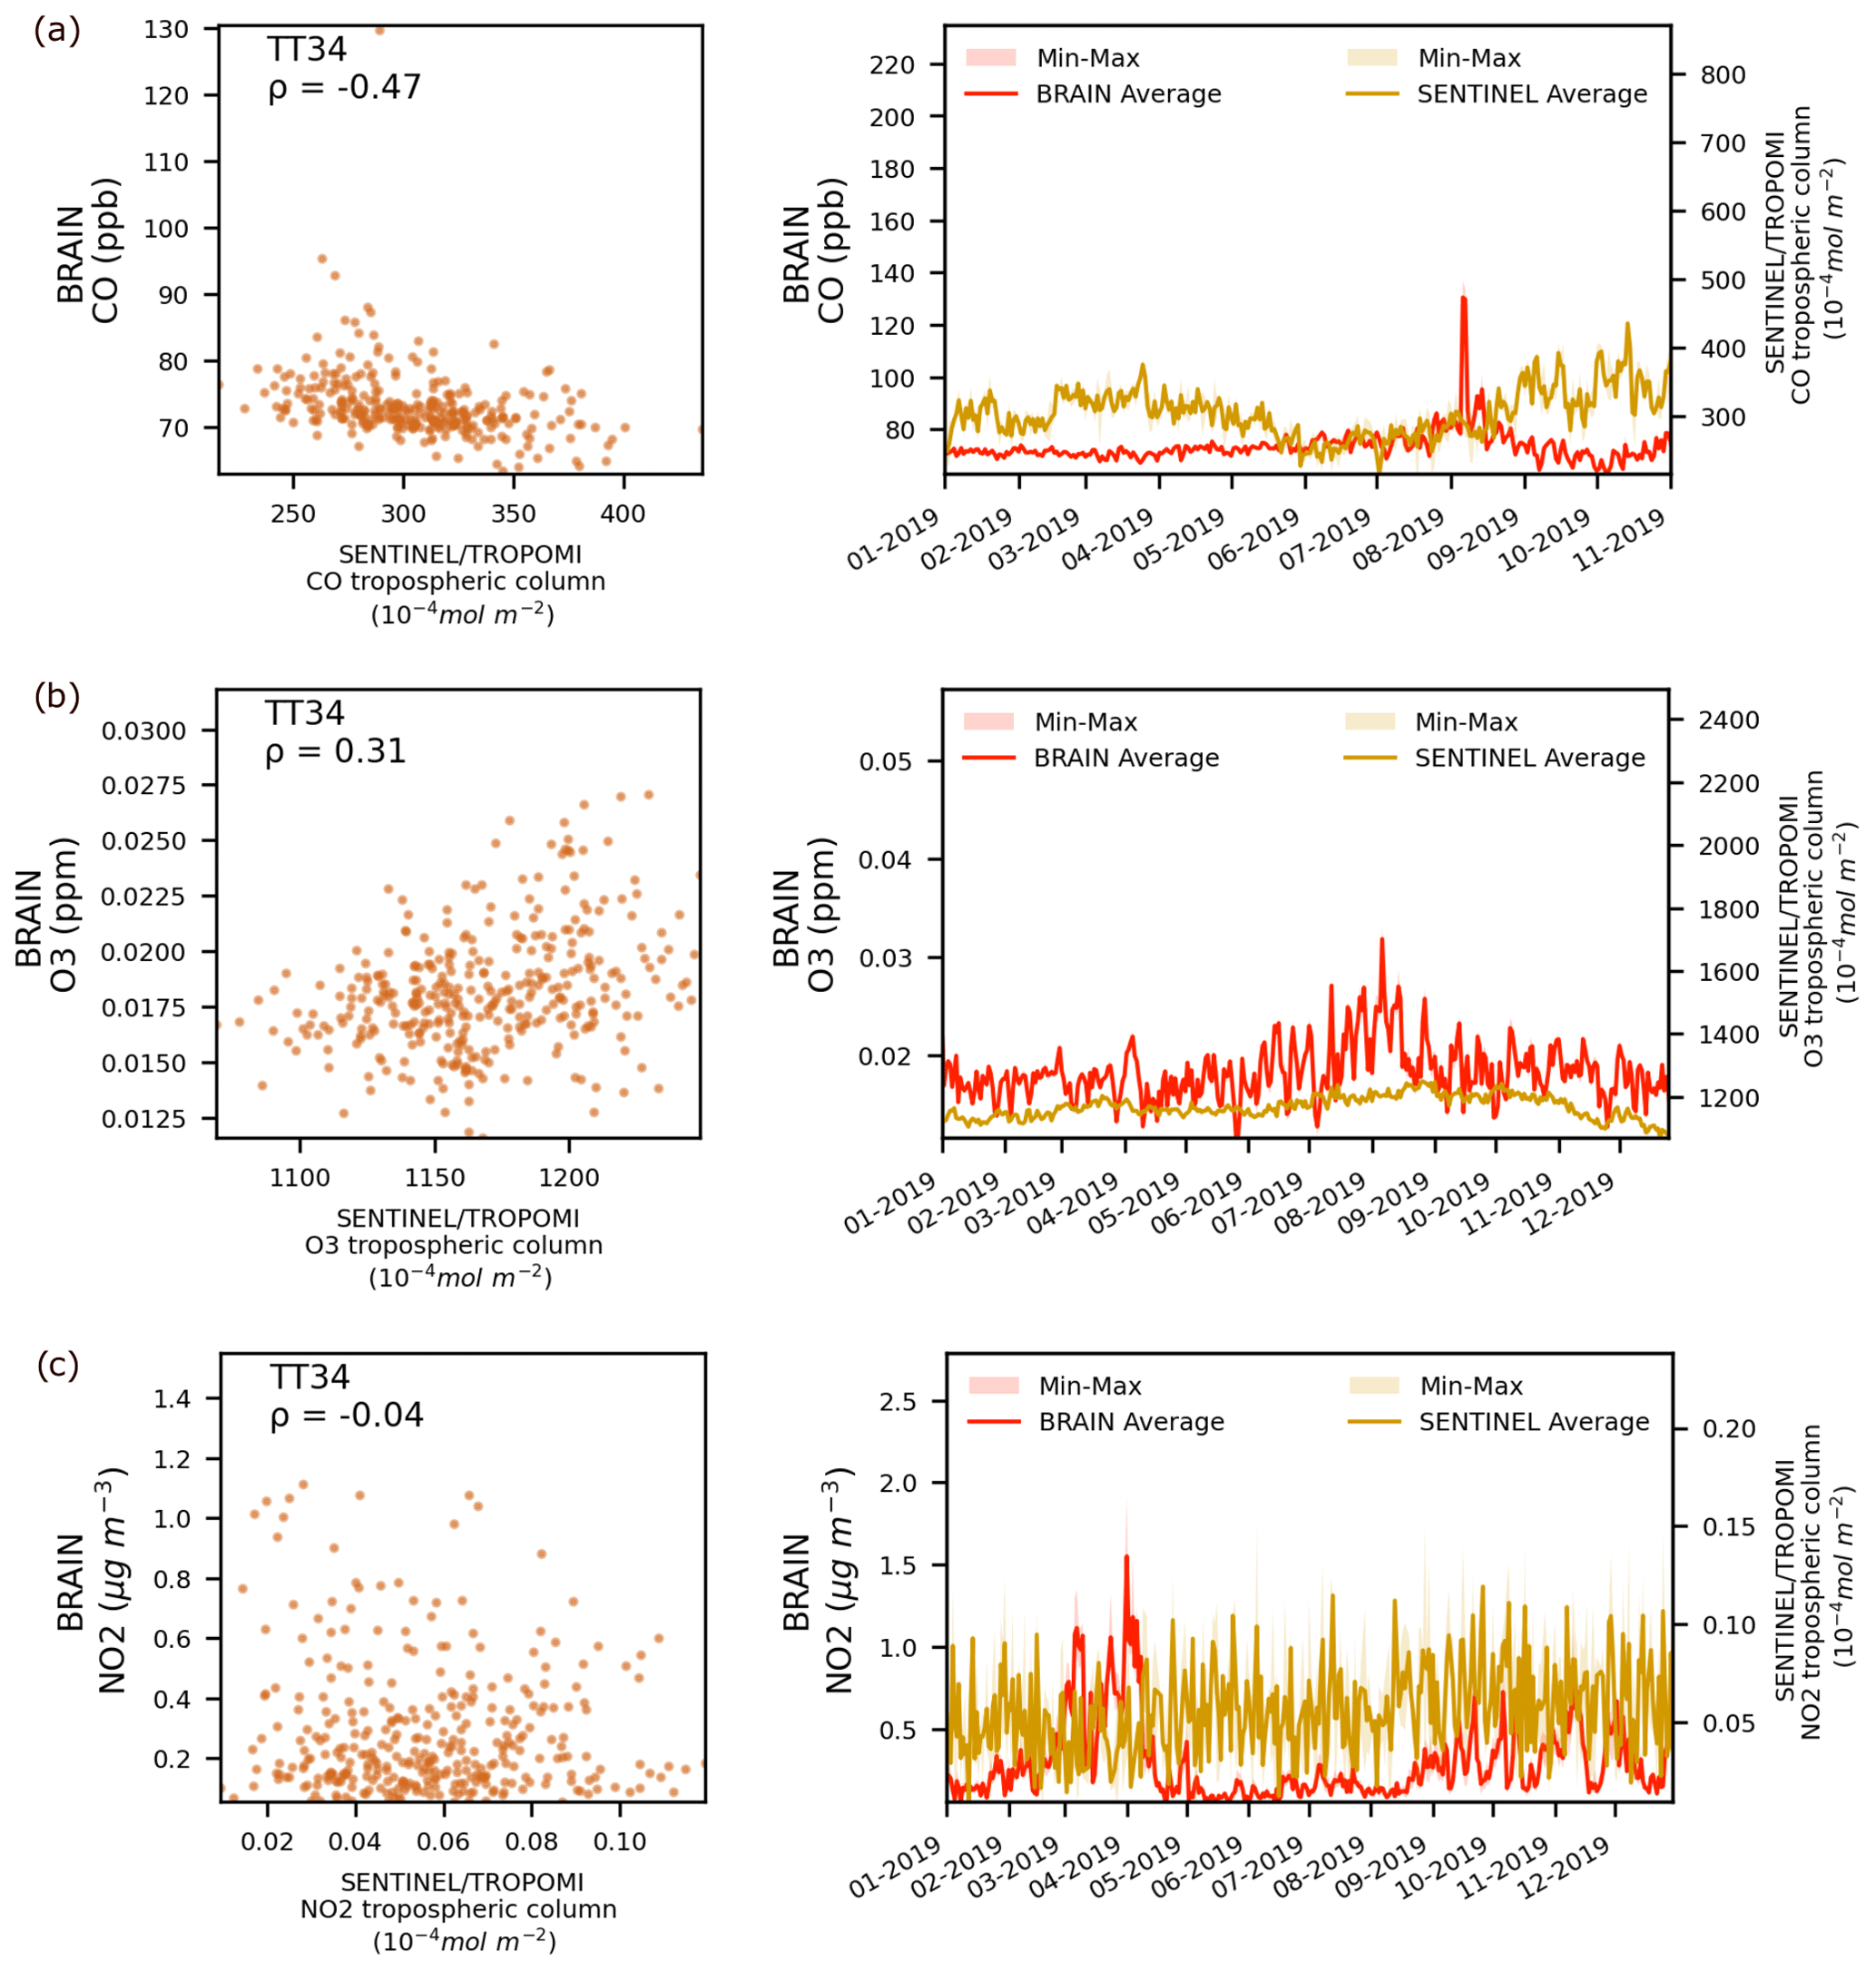
Figure 12Scatterplot and daily time series of CO, O3, and NO2 from BRAIN and Sentinel-5P TROPOMI at T0t/TT34 (GoAmazon reference). Values extracted using a buffer of 0.2° around the site.
BRAIN has a similar spatial pattern compared with MERRA-2 (GMAO, 2015a b), capturing hotspots in higher populated areas located in the southeast, south, and midwest. In the Amazon region, BRAIN can also capture hotspots similarly to MERRA-2 (Fig. 6). BRAIN estimates for carbon monoxide are lower than those of MERRA-2, except in the southern region and in some urban centers in the southeast and midwest (Fig. 6). Carbon monoxide concentrations estimated by BRAIN are moderately correlated with MERRA-2, mainly in the south (0.57) and southeast (0.55), while in the midwest, north, and northeast, the correlation is weaker (Fig. 7). Compared with the consolidated MERRA-2 database, BRAIN has the advantage since it uses local and more refined information and provides data at a higher spatial resolution for multiple species. We provide a detailed comparison between the MERRA-2 and BRAIN datasets for PM2.5, SO2, O3, and CO in Sect. S16.
We also compare our database with Sentinel-5P TROPOMI (Veefkind et al., 2012) data to demonstrate BRAIN's ability to capture the spatiotemporal variability of air pollutants in unmonitored areas (Fig. 8). We spatially realign Sentinel-5P TROPOMI products to the BRAIN resolution (20×20 km) using data from the NASA Goddard Earth Sciences Data and Information Services Center (GES-DISC) (https://disc.gsfc.nasa.gov/, last access: 8 May 2024). We merged all layers of the same day and interpolated them to match the BRAIN resolution. We computed the daily averages for both datasets. In this evaluation, we must consider the differences between the datasets since Sentinel-5P TROPOMI relies on tropospheric column measurements and BRAIN surface concentrations. BRAIN captured the hotspots of CO and NO2 similarly to Sentinel-5P TROPOMI products, especially in southeastern Brazil. However, the hotspots of CO are dislocated towards the ocean in Sentinel-5P TROPOMI. NO2 estimates from BRAIN present a higher number of hotspots. We emphasize that surface concentration data are more suitable than tropospheric column data in representing air quality. In this analysis, we removed negative values from Sentinel-5P TROPOMI products since they represent low-quality measurements (Eskes et al., 2022).
When we compared CO daily datasets from BRAIN and Sentinel-5P TROPOMI by Brazilian regions, we observed a moderate correlation in the north (0.41), midwest (0.32), and south (0.3). This analysis shows that BRAIN can reasonably detect temporal and spatial patterns of air pollutants. The complete comparison of CO and NO2 from Sentinel-5P TROPOMI and BRAIN can be found in Sect. S17.
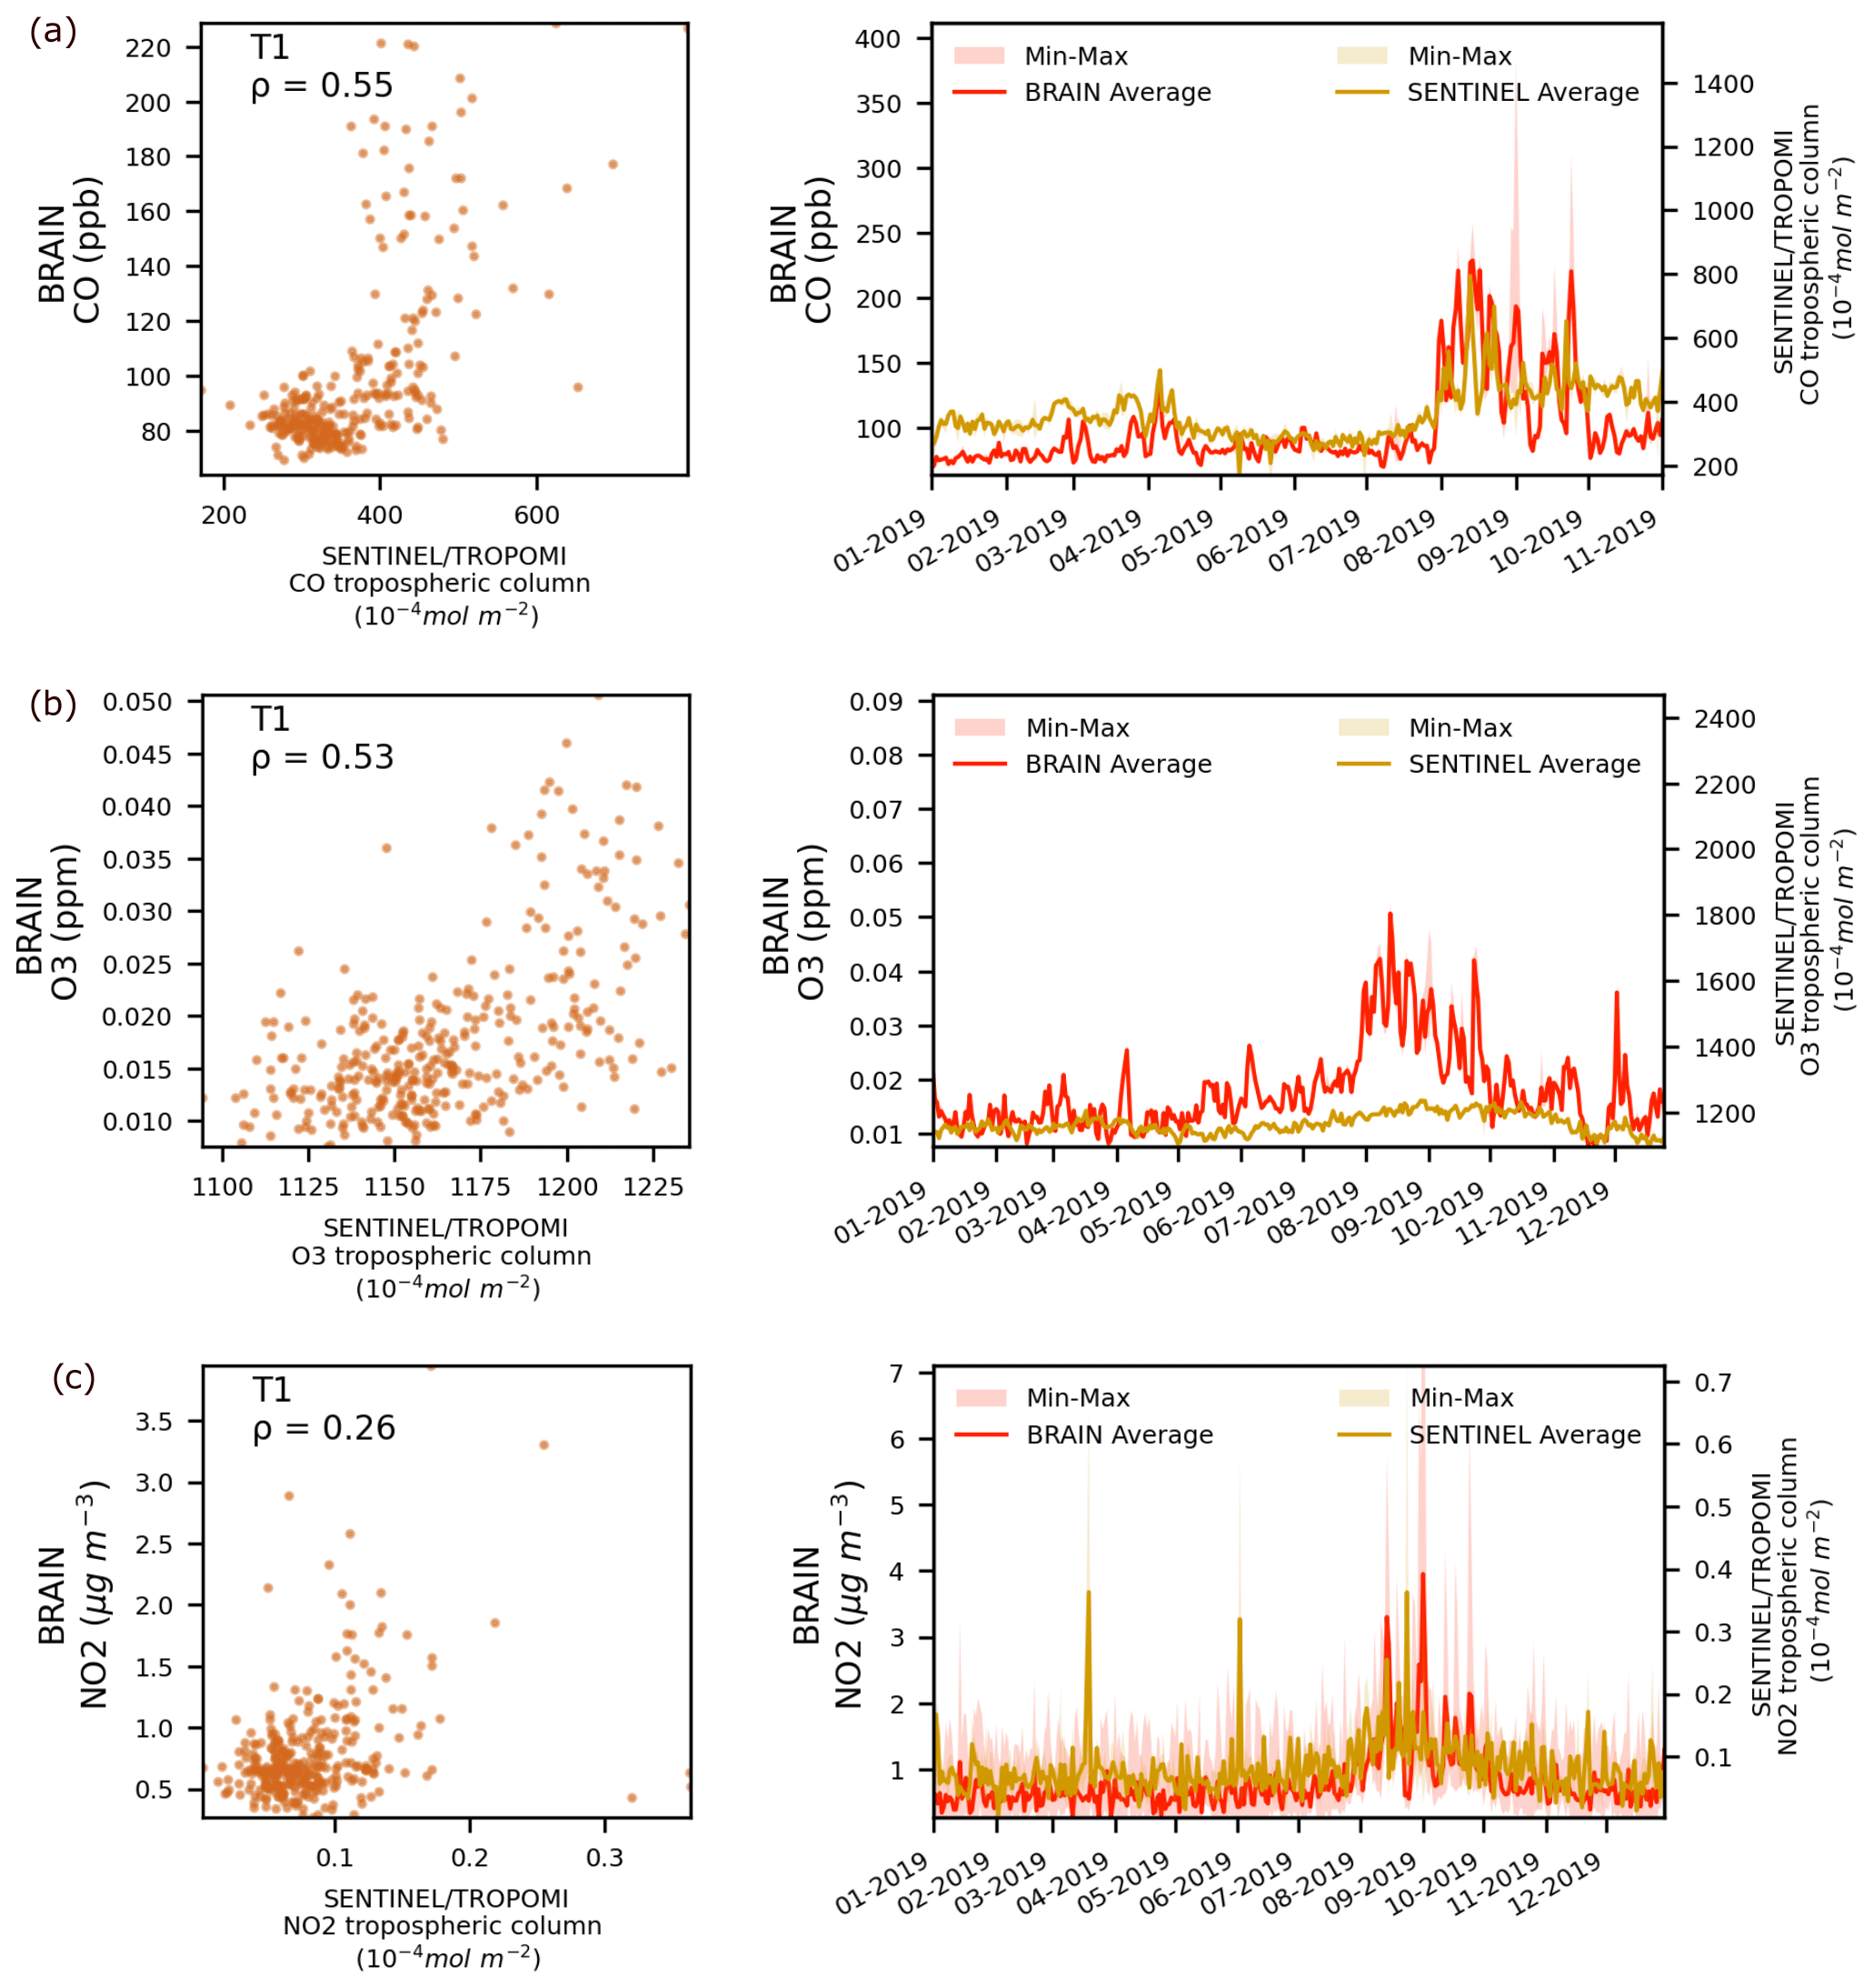
Figure 13Scatter plot and daily time series of CO (a), O3 (b), and NO2 (c) from BRAIN and Sentinel-5P TROPOMI at T1 (GoAmazon reference). Values extracted using a buffer of 0.2° around the site.
We highlight that BRAIN, MERRA-2, and Sentinel-5P TROPOMI can capture similar temporal patterns of air pollutant concentrations in heavily biomass-burning-impacted sites such as Porto Velho in Rondônia (Fig. 10) and in urban areas such as São Paulo. We provide time series (minimum–maximum and average) of BRAIN, MERRA-2, and Sentinel-5P TROPOMI data spatially averaged within Brazilian capitals in Sect. S18. Section S19 contains time series (only average) of BRAIN data in Brazilian capitals.
To analyze BRAIN's performance in background regions (with low anthropogenic influence), we extracted data from two forested sites in the Brazilian northern region. As reference, we used the sampling sites of the GoAmazon experiment (Martin et al., 2016), named T0a (forested site situated 154.1 km from the Manaus urban area) and T0t/TT34 (a broken-canopy forested site situated 60.9 km from the city of Manaus). Sentinel-5P TROPOMI data spatially aligned to the BRAIN resolution were also extracted for comparison. A buffer of 0.2° around the sites selected the data of CO, O3, and NO2 from both datasets. The results revealed that BRAIN captured the seasonal profile at T0a (Fig. 11), showing a moderate correlation with the tropospheric column measurements of Sentinel-5P TROPOMI, especially for CO and O3.
BRAIN estimates are slightly higher than the observed concentrations in background areas of CO, O3, and NO2 in TT34 (Fig. 12) and T0a (Fig. 11). While O3 concentrations simulated by BRAIN range around 18 ppb (average in 2019) at the TT34 site, observed concentrations in 2013 (Artaxo et al., 2013) were around 8.5 ppb ± 1.9 ppb. In T0a, BRAIN simulated concentrations around 16 ppb, overestimating the observations (7 ppb ± 2 ppb during the wet season from March to April 2013–2020) (Nascimento et al., 2022). Concerning CO, the concentrations simulated by BRAIN are slightly lower, ranging around 73 ppb (average) at TT34 compared to the 130 ppb observed during the GoAmazon experiment from 2010 to 2011 (Artaxo et al., 2013). We emphasize that the BRAIN and GoAmazon datasets are reported in different periods and, consequently, are influenced by different emission rates. For instance, fire emissions have changed significantly since 2011 in the Amazon (Copernicus, 2022; Naus et al., 2022).
We also analyzed BRAIN results in the Manaus urban area. We adopted the sampling site of the GoAmazon experiment (Martin et al., 2016) named T1 (INPA campus in Manaus). Compared with Sentinel-5P TROPOMI data, BRAIN reproduced fairly the temporal pattern of CO, O3, and NO2 in the T1 site (Fig. 13). Abou Rafee et al. (2017) reported mean concentrations of 88.7 ppb for NOx and 382.6 pbb for CO in the Manaus urban area, while BRAIN reached 79 and 99 ppb (maximum of 383 ppb), revealing an underestimation in this area. Again, the sampling campaign presented by Abou Rafee et al. (2017) and the BRAIN simulations use different base years. Comparing BRAIN at T0a/TT34 (background sites) and T1 (urbanized), the database has reached consistent results, with lower concentration levels in preserved areas.
The inability to better predict the observations is mostly due to the quality of the emissions inventory. The lack of information on industrial emissions and their temporal variability is an important source of errors. Moreover, the vehicular emissions inventory also needs improvements to properly disaggregate the emissions in high-flow roads. Future versions of BRAIN could address these issues and incorporate other emission sources.
Emission data are available at https://doi.org/10.57760/sciencedb.09858 (Hoinaski et al., 2023a) and https://doi.org/10.57760/sciencedb.09886 (Hoinaski et al., 2023b). Meteorology data are available at https://doi.org/10.57760/sciencedb.09857 (Hoinaski and Will, 2023a) and https://doi.org/10.57760/sciencedb.09885 (Hoinaski and Will, 2023c). Air quality data are available at https://doi.org/10.57760/sciencedb.09859 (Hoinaski and Will, 2023b) and https://doi.org/10.57760/sciencedb.09884 (Hoinaski and Will, 2023d).
Code to generate the database, statistics, and figures is available at https://github.com/leohoinaski/CMAQrunner (last access: 8 May 2024) or https://doi.org/10.5281/zenodo.11166975 (Hoinaski, 2024b) and https://github.com/leohoinaski/IND_Inventory (last access: 8 May 2024) or https://doi.org/10.5281/zenodo.11167115 (Hoinaski, 2024a).
In this paper, we present BRAIN, the first comprehensive database for air quality management in Brazil. BRAIN provides emissions, meteorology, and air quality datasets for the entire country at a reliable spatiotemporal resolution. The BRAIN database covers a wide range of pollutant species (emissions and ambient concentrations) and atmospheric variables. So far, Brazil has lacked a comprehensive and easily accessible database for developing air quality management systems in urbanized and rural areas. This work contributes to overcoming this gap. BRAIN is a step forward toward a good procedure for licensing new sources of air pollution in Brazil.
Using a sample of BRAIN, we observed several violations of WHO air quality recommendations. The violations are not restricted to densely populated areas but also occur in rural ones. This reinforces the need for better air quality policies and a deep restructuring of the environmental agencies' procedures and data management in Brazil.
Compared with observations, the BRAIN air quality dataset has achieved good overall performance in predicting the criteria pollutants. However, there is plenty of room for improvement, mainly in relation to the quality of the emissions inventory. The lack of information on industrial emissions and their temporal variability is an important source of error. Moreover, the vehicular emissions inventory also needs improvements to properly disaggregate the emissions in high-flow roads. Improvements in boundary conditions and the inclusion of emission sources from other Latin American countries could also enhance the CMAQ performance. The influence of long-range transport will be addressed in a future version of the database by implementing boundary contributions from GEOSCHEM and other tools. Future versions of BRAIN could address these issues, incorporate other emission sources, and provide CMAQ outputs using different chemical mechanisms. We envision providing enough data to reproduce the historical pattern and future scenarios of air pollution in Brazil through a web platform to facilitate the access and usage of our database. We believe in an ongoing process that will improve the database.
The supplement related to this article is available online at: https://doi.org/10.5194/essd-16-2385-2024-supplement.
LH designed the methodology and developed the software. LH, RW, and CBR processed the data curation, conducted the formal analysis, and created the figures. LH, RW, and CBR prepared the original draft and revised the paper. LH is the project administrator and laboratory supervisor.
The contact author has declared that none of the authors has any competing interests.
Publisher’s note: Copernicus Publications remains neutral with regard to jurisdictional claims made in the text, published maps, institutional affiliations, or any other geographical representation in this paper. While Copernicus Publications makes every effort to include appropriate place names, the final responsibility lies with the authors.
The authors would like to thank the Secretaria de Estado do Desenvolvimento Econômico Sustentável do governo de Santa Catarina. The authors are grateful for the doctoral scholarships provided by the Coordenação de Aperfeiçoamento de Pessoal de Nível Superior – Brasil (CAPES).
This research has been supported by the Fundação de Amparo à Pesquisa e Inovação do Estado de Santa Catarina (grant no. 2018/TR/499; “Avaliação do impacto das emissões veiculares, queimadas, industriais e naturais na qualidade do ar em Santa Catarina”).
This paper was edited by Jing Wei and reviewed by two anonymous referees.
Abou Rafee, S. A., Martins, L. D., Kawashima, A. B., Almeida, D. S., Morais, M. V. B., Souza, R. V. A., Oliveira, M. B. L., Souza, R. A. F., Medeiros, A. S. S., Urbina, V., Freitas, E. D., Martin, S. T., and Martins, J. A.: Contributions of mobile, stationary and biogenic sources to air pollution in the Amazon rainforest: a numerical study with the WRF-Chem model, Atmos. Chem. Phys., 17, 7977–7995, https://doi.org/10.5194/acp-17-7977-2017, 2017.
Albuquerque, T. T. A., de Fátima Andrade, M., Ynoue, R. Y., Moreira, D. M., Andreão, W. L., dos Santos, F. S., and Nascimento, E. G. S.: WRF-SMOKE-CMAQ modeling system for air quality evaluation in São Paulo megacity with a 2008 experimental campaign data, Environ. Sci. Pollut. Res., 25, 36555–36569, https://doi.org/10.1007/S11356-018-3583-9, 2018.
Brazilian National Agency for Oil, Natural Gas and Biofuel (ANP): Vendas de derivados de petróleo e biocombustíveis, https://www.gov.br/anp/pt-br/centrais-de-conteudo/dados-abertos/vendas-de-derivados-de-petroleo-e-biocombustiveis (last access: 8 May 2024).
Appel, K. W., Bash, J. O., Fahey, K. M., Foley, K. M., Gilliam, R. C., Hogrefe, C., Hutzell, W. T., Kang, D., Mathur, R., Murphy, B. N., Napelenok, S. L., Nolte, C. G., Pleim, J. E., Pouliot, G. A., Pye, H. O. T., Ran, L., Roselle, S. J., Sarwar, G., Schwede, D. B., Sidi, F. I., Spero, T. L., and Wong, D. C.: The Community Multiscale Air Quality (CMAQ) model versions 5.3 and 5.3.1: system updates and evaluation, Geosci. Model Dev., 14, 2867–2897, https://doi.org/10.5194/gmd-14-2867-2021, 2021.
Arfan Ali, Md., Bilal, M., Wang, Y., Nichol, J. E., Mhawish, A., Qiu, Z., de Leeuw, G., Zhang, Y., Zhan, Y., Liao, K., Almazroui, M., Dambul, R., Shahid, S., and Islam, M. N.: Accuracy assessment of CAMS and MERRA-2 reanalysis PM2.5 and PM10 concentrations over China, Atmos. Environ., 288, 119297, https://doi.org/10.1016/j.atmosenv.2022.119297, 2022.
Artaxo, P., Rizzo, L. V., Brito, J. F., Barbosa, H. M., Arana, A., Sena, E. T., Cirino, G. G., Bastos, W., Martin, S. T., and Andreae, M. O.: Atmospheric aerosols in Amazonia and land use change: from natural biogenic to biomass burning conditions, Faraday Discuss., 165, 203–235, https://doi.org/10.1039/C3FD00052D, 2013.
Bey, I., Jacob, D. J., Yantosca, R. M., Logan, J. A., Field, B. D., Fiore, A. M., Li, Q., Liu, H. Y., Mickley, L. J., and Schultz, M. G.: Global modeling of tropospheric chemistry with assimilated meteorology: Model description and evaluation, J. Geophys. Res.-Atmos., 106, 23073–23095, https://doi.org/10.1029/2001JD000807, 2001.
Bieser, J., Aulinger, A., Matthias, V., Quante, M., and Denier Van Der Gon, H. A. C.: Vertical emission profiles for Europe based on plume rise calculations, Environ. Pollut., 159, 2935–2946, https://doi.org/10.1016/J.ENVPOL.2011.04.030, 2011.
Briggs, G. A.: Plume Rise: A Critical Survey, https://doi.org/10.2172/4743102, 1969.
Briggs, G. A.: Plume rise predictions, TENNESSEE, U.S.A., Environ. Res. Labs., 59–111, https://doi.org/10.1007/978-1-935704-23-2_3, 1975.
Cavalcanti, I. F.: Tempo e clima no Brasil, Oficina de textos, eISBN 978-85-7975-234-6, 2016.
CEIC: Brazil Vehicel Fleet: by Region, https://www.ceicdata.com/en/brazil/vehicle-fleet-by-region (last access: 8 May 2024) 2021.
Cheng, J., Su, J., Cui, T., Li, X., Dong, X., Sun, F., Yang, Y., Tong, D., Zheng, Y., Li, Y., Li, J., Zhang, Q., and He, K.: Dominant role of emission reduction in PM2.5 air quality improvement in Beijing during 2013–2017: a model-based decomposition analysis, Atmos. Chem. Phys., 19, 6125–6146, https://doi.org/10.5194/acp-19-6125-2019, 2019.
Copernicus: Wildfires: Amazonas records highest emissions in 20 years, https://atmosphere.copernicus.eu/wildfires-amazonas-records-highest-emissions-20-years (last access: 8 May 2024), 2022.
Crippa, M., Guizzardi, D., Muntean, M., Schaaf, E., Dentener, F., van Aardenne, J. A., Monni, S., Doering, U., Olivier, J. G. J., Pagliari, V., and Janssens-Maenhout, G.: Gridded emissions of air pollutants for the period 1970–2012 within EDGAR v4.3.2, Earth Syst. Sci. Data, 10, 1987–2013, https://doi.org/10.5194/essd-10-1987-2018, 2018.
Eskes, H., Van Geffen, J., Boersma, F., Eichmann, K.U., Apituley, A., Pedergnana, M., Sneep, M., Veefkind, J.P., and Loyola, D.: Sentinel-5 precursor/TROPOMI Level 2 Product User Manual Nitrogendioxide document number: S5P-KNMI-L2-0021-MA, https://sentinels.copernicus.eu/documents/247904/2474726/Sentinel-5P-Level-2-Product-User-Manual-Nitrogen-Dioxide.pdf/ad25ea4c-3a9a-3067-0d1c-aaa56eb1746b?t=1658312035057 (last access: 8 May 2024), 2022.
Emery, C., Jung, J., Koo, B., and Yarwood, G.: Final Report, Improvements to CAMx Snow Cover Treatments and Carbon Bond Chemical Mechanism for Winter Ozone, Tech. rep., Ramboll Environ, Novato, CA, USA, https://www.camx.com/files/udaq_snowchem_final_6aug15.pdf (last access: 8 May 2024), 2015.
Escobar, H.: Amazon fires clearly linked to deforestation, scientists say, Science, 80, 853, https://doi.org/10.1126/science.365.6456.853, 2019.
Eyth, A., Strum, M., Murphy, B., Epa, U.S., Shah, T., Shi, Y., Beardsley, R., Yarwood, G., and Houyoux, M.: Speciation Tool User's Guide Speciation Tool User's Guide Version 5.0 Ramboll-Speciation Tool User's Guide, https://www.cmascenter.org/speciation_tool/documentation/5.1/Ramboll_sptool_users_guide_V5.pdf (last access: 8 May 2024), 2020.
Gantt, B., Kelly, J. T., and Bash, J. O.: Updating sea spray aerosol emissions in the Community Multiscale Air Quality (CMAQ) model version 5.0.2, Geosci. Model Dev., 8, 3733–3746, https://doi.org/10.5194/gmd-8-3733-2015, 2015.
Global Modeling and Assimilation Office (GMAO): MERRA-2 tavg1_2d_chm_Nx: 2d, 1-Hourly, Time-Averaged, Single-Level, Assimilation, Carbon Monoxide and Ozone Diagnostics V5.12.4, Greenbelt, MD, USA, Goddard Earth Sciences Data and Information Services Center (GES DISC) [data set], https://doi.org/10.5067/3RQ5YS674DGQ, 2015a.
Global Modeling and Assimilation Office (GMAO): MERRA-2 tavg1_2d_aer_Nx: 2d, 1-Hourly, Time-averaged, Single-Level, Assimilation, Aerosol Diagnostics V5.12.4, Greenbelt, MD, USA, Goddard Earth Sciences Data and Information Services Center (GES DISC) [data set], https://doi.org/10.5067/KLICLTZ8EM9D, 2015b.
Gordon, M., Makar, P. A., Staebler, R. M., Zhang, J., Akingunola, A., Gong, W., and Li, S.-M.: A comparison of plume rise algorithms to stack plume measurements in the Athabasca oil sands, Atmos. Chem. Phys., 18, 14695–14714, https://doi.org/10.5194/acp-18-14695-2018, 2018.
Guenther, A. B., Jiang, X., Heald, C. L., Sakulyanontvittaya, T., Duhl, T., Emmons, L. K., and Wang, X.: The Model of Emissions of Gases and Aerosols from Nature version 2.1 (MEGAN2.1): an extended and updated framework for modeling biogenic emissions, Geosci. Model Dev., 5, 1471–1492, https://doi.org/10.5194/gmd-5-1471-2012, 2012.
Guevara, M., Soret, A., Arévalo, G., Martínez, F., and Baldasano, J. M.: Implementation of plume rise and its impacts on emissions and air quality modelling, Atmos. Environ., 99, 618–629, https://doi.org/10.1016/J.ATMOSENV.2014.10.029, 2014.
Henderson, B.: [Fire emission pre-processor for CMAQ], finntocmaq, GitHub [code], https://github.com/barronh/finn2cmaq (last access: 8 May 2024), 2022.
Hogrefe, C., Isukapalli, S. S., Tang, X., Georgopoulos, P. G., He, S., Zalewsky, E. E., Hao, W., Ku, J. Y., Key, T., and Sistla, G.: Impact of Biogenic Emission Uncertainties on the Simulated Response of Ozone and Fine Particulate Matter to Anthropogenic Emission Reductions, J. Air Waste Manage., 61, 92–108, https://doi.org/10.3155/1047-3289.61.1.92, 2011.
Hoinaski, L.: leohoinaski/IND_Inventory: IND2CMAQ_v1.0 (IND2CMAQ_v1.0), Zenodo [code], https://doi.org/10.5281/zenodo.11167115, 2024a.
Hoinaski, L.: CMAQrunner_v1.0, Zenodo [code], https://doi.org/10.5281/zenodo.11166975, 2024b.
Hoinaski, L. and Will, R.: Brazilian Atmospheric Inventories – BRAIN version 1: meteorology dataset in Brazil, V1, Science Data Bank [data set], https://doi.org/10.57760/sciencedb.09857, 2023a.
Hoinaski, L. and Will, R.: Brazilian Atmospheric Inventories – BRAIN version 1: air quality dataset in Brazil, V1, Science Data Bank [data set], https://doi.org/10.57760/sciencedb.09859, 2023b.
Hoinaski, L., and Will, R.: Brazilian Atmospheric Inventories – BRAIN version 1: meteorology dataset in Southern Brazil, V1, Science Data Bank [data set], https://doi.org/10.57760/sciencedb.09885, 2023c.
Hoinaski, L. and Will, R.: Brazilian Atmospheric Inventories – BRAIN version 1: air quality dataset in Southern Brazil, V1, Science Data Bank [data set], https://doi.org/10.57760/sciencedb.09884, 2023d.
Hoinaski, L., Ribeiro, C. B., Santos, O. N., Vasques, T. V., Meotti, B., Will, R., and Rodella, F. H. C.: Avaliação do impacto das emissões veiculares, queimadas, industriais e naturais na qualidade do ar em Santa Catarina, 2020.
Hoinaski, L., Vasques, T. V., Ribeiro, C. B., and Meotti, B.: Multispecies and high-spatiotemporal-resolution database of vehicular emissions in Brazil, Earth Syst. Sci. Data, 14, 2939–2949, https://doi.org/10.5194/essd-14-2939-2022, 2022.
Hoinaski, L., Will, R., and Ribeiro, C. B.: Brazilian Atmospheric Inventories – BRAIN version 1: emission dataset in Brazil, V1, Science Data Bank [data set], https://doi.org/10.57760/sciencedb.09858, 2023a.
Hoinaski, L., Will, R., and Ribeiro, C. B.: Brazilian Atmospheric Inventories – BRAIN version 1: emission dataset in Southern Brazil, V1, Science Data Bank [data set], https://doi.org/10.57760/sciencedb.09886, 2023b.
Inness, A., Ades, M., Agustí-Panareda, A., Barré, J., Benedictow, A., Blechschmidt, A.-M., Dominguez, J. J., Engelen, R., Eskes, H., Flemming, J., Huijnen, V., Jones, L., Kipling, Z., Massart, S., Parrington, M., Peuch, V.-H., Razinger, M., Remy, S., Schulz, M., and Suttie, M.: The CAMS reanalysis of atmospheric composition, Atmos. Chem. Phys., 19, 3515–3556, https://doi.org/10.5194/acp-19-3515-2019, 2019.
Instituto Brasileiro de Geografia e Estatística (IBGE): Brasil em síntese, https://brasilemsintese.ibge.gov.br/territorio.html, last access: 8 May 2024.
Instituto de Energia e Meio Ambiente (IEMA): Recomendações para a expansão e a continuidade das redes de monitoramento da qualidade do ar no Brasil, https://energiaeambiente.org.br/wp-content/uploads/2022/07/IEMA_policypaper_qualidadedoar.pdf (last access: 8 May 2024), 2022.
Instituto de Energia e Meio Ambiente (IEMA): Plataforma de qualidade do ar, https://energiaeambiente.org.br/qualidadedoar/, last access: 8 May 2024.
Kawashima, A. B., Martins, L. D., Abou Rafee, S. A., Rudke, A. P., de Morais, M. V., and Martins, J. A.: Development of a spatialized atmospheric emission inventory for the main industrial sources in Brazil, Environ. Sci. Pollut. Res., 27, 35941–35951, https://doi.org/10.1007/S11356-020-08281-7, 2020.
Kitagawa, Y. K. L., Pedruzzi, R., Galvão, E. S., de Araújo, I. B., de Almeira Alburquerque, T. T., Kumar, P., Nascimento, E. G. S., and Moreira, D. M.: Source apportionment modelling of PM2.5 using CMAQ-ISAM over a tropical coastal-urban area, Atmos. Pollut. Res., 12, 101250, https://doi.org/10.1016/J.APR.2021.101250, 2021.
Kitagawa, Y. K. L., Kumar, P., Galvão, E. S., Santos, J. M., Reis, N. C., Nascimento, E. G. S., and Moreira, D. M.: Exposure and dose assessment of school children to air pollutants in a tropical coastal-urban area, Sci. Total Environ., 803, 149747, https://doi.org/10.1016/J.SCITOTENV.2021.149747, 2022.
Kota, S. H., Schade, G., Estes, M., Boyer, D., and Ying, Q.: Evaluation of MEGAN predicted biogenic isoprene emissions at urban locations in Southeast Texas, Atmos. Environ., 110, 54–64, https://doi.org/10.1016/J.ATMOSENV.2015.03.027, 2015.
Levy, R. and Hsu, C.: MODIS Atmosphere L2 Aerosol Product, NASA MODIS Adaptive Processing System, Goddard Space Flight Center, USA [data set], https://doi.org/10.5067/MODIS/MOD04_L2.006, 2015.
Macedo, L. R., Basso, J. L. M., Yamasaki, Y., Macedo, L. R., Basso, J. L. M., and Yamasaki, Y.: Evaluation of the WRF Weather Forecasts over the Southern Region of Brazil, Am. J. Clim. Chang., 5, 103–115, https://doi.org/10.4236/AJCC.2016.51011, 2016.
Makri, A. and Stilianakis, N. I.: Vulnerability to air pollution health effects, Int. J. Hyg. Environ. Health, 211, 326–336, https://doi.org/10.1016/J.IJHEH.2007.06.005, 2008.
Martin, S. T., Artaxo, P., Machado, L. A. T., Manzi, A. O., Souza, R. A. F., Schumacher, C., Wang, J., Andreae, M. O., Barbosa, H. M. J., Fan, J., Fisch, G., Goldstein, A. H., Guenther, A., Jimenez, J. L., Pöschl, U., Silva Dias, M. A., Smith, J. N., and Wendisch, M.: Introduction: Observations and Modeling of the Green Ocean Amazon (GoAmazon2014/5), Atmos. Chem. Phys., 16, 4785–4797, https://doi.org/10.5194/acp-16-4785-2016, 2016.
Mendonça, F. and Danni-Oliveira, I. M.: Climatologia: noções básicas e climas do Brasil, Oficina de textos, eISBN 978-85-7975-114-1, 2017.
Ministério de Minas e Energia (MME): Dados estatísticos, https://www.gov.br/anp/pt-br/centrais-de-conteudo/dados-estatisticos (last access: 8 May 2024).
Ministério do Meio Ambiente (MMA): Inventário Nacional de Emissões Atmosféricas por Veículos Automotores Rodoviários 2013, https://antigo.mma.gov.br/images/arquivo/80060/Inventario_de_Emissoes_por_Veiculos_Rodoviarios_2013.pdf (last access: 8 May 2024), 2014.
National Energy Balance (BEN): Balanço Energético Nacional, https://www.epe.gov.br/pt/publicacoes-dados-abertos/publicacoes/balanco-energetico-nacional-ben, last access: 8 May 2024.
Nascimento, J. P., Barbosa, H. M. J., Banducci, A. L., Rizzo, L. V., Vara-Vela, A. L., Meller, B. B., Gomes, H., Cezar, A., Franco, M. A., Ponczek, M., Wolff S., Bela, M. M., and Artaxo, P.: Major Regional-Scale Production of O3 and Secondary Organic Aerosol in Remote Amazon Regions from the Dynamics and Photochemistry of Urban and Forest Emissions, Environ. Sci. Technol., 56, 9924–9935, https://doi.org/10.1021/acs.est.2c01358, 2022.
Naus, S., Domingues, L. G., Krol, M., Luijkx, I. T., Gatti, L. V., Miller, J. B., Gloor, E., Basu, S., Correia, C., Koren, G., Worden, H. M., Flemming, J., Pétron, G., and Peters, W.: Sixteen years of MOPITT satellite data strongly constrain Amazon CO fire emissions, Atmos. Chem. Phys., 22, 14735–14750, https://doi.org/10.5194/acp-22-14735-2022, 2022.
Nogueira, T., de Souza, K. F., Fornaro, A., de Fatima Andrade, M., and de Carvalho, L. R. F.: On-road emissions of carbonyls from vehicles powered by biofuel blends in traffic tunnels in the Metropolitan Area of Sao Paulo, Brazil, Atmos. Environ., 108, 88–97, https://doi.org/10.1016/J.ATMOSENV.2015.02.064, 2015.
Organization of Economic Co-operation and Development (OECD): The economic consequences of outdoor air pollution, https://www.oecd.org/env/the-economic-consequences-of-outdoor-air-pollution-9789264257474-en.htm (last access: 8 May 2024), 2016.
Organization of Economic Co-operation and Development (OECD): Air pollution, https://www.oecd.org/environment/air-pollution/, last access: 8 May 2024.
Park, S. K., Evan Cobb, C., Wade, K., Mulholland, J., Hu, Y., and Russell, A. G.: Uncertainty in air quality model evaluation for particulate matter due to spatial variations in pollutant concentrations, Atmos. Environ., 40, 563–573, https://doi.org/10.1016/J.ATMOSENV.2005.11.078, 2006.
Pedruzzi, R., Baek, B. H., Henderson, B. H., Aravanis, N., Pinto, J. A., Araujo, I. B., Nascimento, E. G. S., Reis Junior, N. C., Moreira, D. M., and de Almeida Albuquerque, T. T.: Performance evaluation of a photochemical model using different boundary conditions over the urban and industrialized metropolitan area of Vitória, Brazil, Environ. Sci. Pollut. Res., 26, 16125–16144, https://doi.org/10.1007/S11356-019-04953-1, 2019.
Pedruzzi, R., Andreão, W. L., Baek, B. H., Hudke, A. P., Glotfelty, T. W., Dias de Freitas, E., Martins, J. A., Bowden, J. H., Pinto, J. A., Alonso, M. F., and de Almeida Abuquerque, T. T.: Update of land use/land cover and soil texture for Brazil: Impact on WRF modeling results over São Paulo, Atmos. Environ., 268, 118760, https://doi.org/10.1016/J.ATMOSENV.2021.118760, 2022.
Pereira, G., Siqueira, R., Rosário, N. E., Longo, K. L., Freitas, S. R., Cardozo, F. S., Kaiser, J. W., and Wooster, M. J.: Assessment of fire emission inventories during the South American Biomass Burning Analysis (SAMBBA) experiment, Atmos. Chem. Phys., 16, 6961–6975, https://doi.org/10.5194/acp-16-6961-2016, 2016.
Platnick, S., Hubanks, P., Meyer, K., and King, M. D.: MODIS Atmosphere L3 Monthly Product (08_L3), NASA MODIS Adaptive Processing System, Goddard Space Flight Center [data set], https://doi.org/10.5067/MODIS/MOD08_M3.006, 2015.
Rajão, R., Soares-Filho, B., Nunes, F., Börner, J., Machado, L., Assis, D., Oliveira, A., Pinto, L., Ribeiro, V., Rausch, L., Gibbs, H., and Figueira, D.: The rotten apples of Brazil's agribusiness, Science, 80, 369, 246–248, https://doi.org/10.1126/SCIENCE.ABA6646, 2020.
Sant'Anna, A., Alencar, A., Araújo, C., Vormittag, E., Wicher, H., Cunha, K. B. da, Faria, M., de Fatima Andrade, M., Porto, P., Artaxo, P., Rocha, R., Simoni, W. De, Pinheiro, B., and Esturba, T.: O Estado da Qualidade do Ar no Brasil, https://www.wribrasil.org.br/sites/default/files/wri-o-estado-da-_qualidade-do-ar-no-brasil.pdf (last access: 8 May 2024), 2021.
Shin, M., Kang, Y., Park, S., Im, J., Yoo, C., and Quackenbush, L. J.: Estimating ground-level particulate matter concentrations using satellite-based data: a review, GISci. Remote Sens., 57, 174–189, https://doi.org/10.1080/15481603.2019.1703288, 2020.
Skamarock, W. C., Klemp, J. B., Dudhia, J., Gill, D. O., Barker, D., Duda, M. G., and Powers, J. G.: A Description of the Advanced Research WRF Version 3 (No. NCAR/TN-475+STR), University Corporation for Atmospheric Research, https://doi.org/10.5065/D68S4MVH, 2008.
Silva, S. J., Heald, C. L., and Guenther, A. B.: Development of a reduced-complexity plant canopy physics surrogate model for use in chemical transport models: a case study with GEOS-Chem v12.3.0, Geosci. Model Dev., 13, 2569–2585, https://doi.org/10.5194/gmd-13-2569-2020, 2020.
Sindelarova, K., Granier, C., Bouarar, I., Guenther, A., Tilmes, S., Stavrakou, T., Müller, J.-F., Kuhn, U., Stefani, P., and Knorr, W.: Global data set of biogenic VOC emissions calculated by the MEGAN model over the last 30 years, Atmos. Chem. Phys., 14, 9317–9341, https://doi.org/10.5194/acp-14-9317-2014, 2014.
Souza, N. B. P., Cardoso dos Santos, J. V., Sperandio Nascimento, E. G., Bandeira Santos, A. A., and Moreira, D. M.: Long-range correlations of the wind speed in a northeast region of Brazil, Energy, 243, 122742, https://doi.org/10.1016/J.ENERGY.2021.122742, 2022a.
Souza, N. B. P., Sperandio, N. E. G., Santos, A. A. B., and Moreira, D. M.: Wind mapping using the mesoscale WRF model in a tropical region of Brazil, Energy, 240, 122491, https://doi.org/10.1016/J.ENERGY.2021.122491, 2022b.
United States Environmental Protection Agency (U.S. EPA): Creating an OCEAN file for input to CMAQ, CMAQ, GitHub [code], https://github.com/U.S.EPA/CMAQ/blob/main/DOCS/Users_Guide/Tutorials/CMAQ_UG_tutorial_oceanfile.md (last access: 8 May 2024), 2022.
United States Environmental Protection Agency (U.S. EPA): Air Quality and Climate Change Research, https://www.epa.gov/air-research/air-quality-and-climate-change-research (last access: 8 May 2024), 2023a.
United States Environmental Protection Agency (U.S. EPA): Air Quality System (AQS), https://www.epa.gov/aqs (last access: 8 May 2024), 2023b.
Vasques, T. V., and Hoinaski, L.: Brazilian vehicular emission inventory software – BRAVES, Transp. Res. Part D Transp. Environ., 100, 103041, https://doi.org/10.1016/J.TRD.2021.103041, 2021.
Veefkind, J. P., Aben, I., McMullan, K., Förster, H., de Vries, J., Otter, G., Claas, J., Eskes, H. J., de Haan, J. F., Kleipool, Q., van Weele, M., Hasekamp, O., Hoogeveen, R., Landgraf, J., Snel, R., Tol, P., Ingmann, P., Voors, R., Kruizinga, B., Vink, R., Visser, H., and Levelt, P. F.: TROPOMI on the ESA Sentinel-5 Precursor: A GMES mission for global observations of the atmospheric composition for climate, air quality and ozone layer applications, Remote Sens. Environ., 120, 70–83, https://doi.org/10.1016/j.rse.2011.09.027, 2012.
Vongruang, P., Wongwises, P., and Pimonsree, S.: Assessment of fire emission inventories for simulating particulate matter in Upper Southeast Asia using WRF-CMAQ, Atmos. Pollut. Res., 8, 921–929, https://doi.org/10.1016/J.APR.2017.03.004, 2017.
Wiedinmyer, C., Akagi, S. K., Yokelson, R. J., Emmons, L. K., Al-Saadi, J. A., Orlando, J. J., and Soja, A. J.: The Fire INventory from NCAR (FINN): a high resolution global model to estimate the emissions from open burning, Geosci. Model Dev., 4, 625–641, https://doi.org/10.5194/gmd-4-625-2011, 2011.
Wiedinmyer, C., Kimura, Y., McDonald-Buller, E. C., Emmons, L. K., Buchholz, R. R., Tang, W., Seto, K., Joseph, M. B., Barsanti, K. C., Carlton, A. G., and Yokelson, R.: The Fire Inventory from NCAR version 2.5: an updated global fire emissions model for climate and chemistry applications, Geosci. Model Dev., 16, 3873–3891, https://doi.org/10.5194/gmd-16-3873-2023, 2023.
Yarwood, G., Jung, J., Whitten, G., Heo, G., Mellberg, J., and Estes, M..: Updates to the Carbon Bond Mechanism for Version 6 (CB6), in: 9th Annual CMAS Conference, Chapel Hill, NC, 11–13, 1-4, https://www.cmascenter.org/conference/2010/abstracts/emery_updates_carbon_2010.pdf (last access: 8 May 2024), 2010.