Quantifying wildlife conflicts with metabarcoding and traditional dietary analyses: applied to seabird predation by long-nosed fur seals
 Natasha A. Hardy1,2,3*
  Tina E. Berry4,5
  Michael Bunce6
  Nathan J. Bott7
  Will F. Figueira2
  Rebecca R. McIntosh1*
- 1Department of Conservation, Phillip Island Nature Parks, Phillip Islands, VIC, Australia
- 2School of Life and Environmental Sciences, Faculty of Science, The University of Sydney, Sydney, NSW, Australia
- 3SMRU Consulting, Vancouver, BC, Canada
- 4Trace and Environmental DNA (TrEnD) Laboratory, School of Molecular and Life Sciences, Curtin University, Perth, WA, Australia
- 5eDNA Frontiers, Department of Environment and Agriculture, Curtin University, Perth, WA, Australia
- 6Environmental Protection Authority, Wellington, New Zealand
- 7School of Science, Royal Melbourne Institute of Technology (RMIT) University, Melbourne, VIC, Australia
Wildlife conflicts require robust quantitative data on incidence and impacts, particularly among species of conservation and cultural concern. We apply a multi-assay framework to quantify predation in a southeastern Australian scenario where complex management implications and calls for predator culling have grown despite a paucity of data on seabird predation by recovering populations of long-nosed fur seals (Arctocephalus forsteri). We apply two ecological surveillance techniques to analyze this predator’s diet – traditional morphometric (prey hard-part) and environmental DNA metabarcoding (genetic) analyses using an avian specific primer for the 12S ribosomal RNA (rRNA) gene – to provide managers with estimated predation incidence, number of seabird species impacted and inter-prey species relative importance to the predator. DNA metabarcoding identified additional seabird taxa and provided relative quantitative information where multiple prey species occur within a sample; while parallel use of both genetic and hard-part analyses revealed a greater diversity of taxa than either method alone. Using data from both assays, the estimated frequency of occurrence of predation on seabirds by long-nosed fur seals ranged from 9.1–29.3% of samples and included up to 6 detected prey species. The most common seabird prey was the culturally valued little penguin (Eudyptula minor) that occurred in 6.1–25.3% of samples, higher than previously reported from traditional morphological assays alone. We then explored DNA haplotype diversity for little penguin genetic data, as a species of conservation concern, to provide a preliminary estimate of the number of individuals consumed. Polymorphism analysis of consumed little penguin DNA identified five distinct mitochondrial haplotypes – representing a minimum of 16 individual penguins consumed across 10 fur seal scat samples (equivalent to 10.1% of samples). We recommend rapid uptake and development of cost-effective genetic techniques and broader spatiotemporal sampling of fur seal diets to further quantify predation and hotspots of concern for wildlife conflict management.
Introduction
New wildlife conservation and management scenarios are emerging during the Anthropocene as some species experience population increases through successful conservation efforts, while others continue to decline (Roman et al., 2015; Marshall et al., 2016; Cammen et al., 2019). Complex management scenarios arise when species recovery results in negative interactions with other species of value, whether that reflects a trophic role in the ecosystem, conservation status, community connection or economic opportunity (Marshall et al., 2016). For example between killer whales, sea otters and salmon (Estes et al., 1998; Williams et al., 2011); New Zealand sea lions and yellow-eyed penguins (Lalas et al., 2007); wolves and caribou (Hervieux et al., 2014); jaguar and marine turtles (Veríssimo et al., 2012); and, between Critically Endangered yellow-breasted capuchin monkeys and Endangered red-billed curassow (Canale and Bernardo, 2016). The interactions are natural but present a need for accurate information on natural predation levels and impacts to prey (Hervieux et al., 2014) to avoid unjustified persecution of the predator (Granquist et al., 2018), and for effective management of all species concerned (Marshall et al., 2016).
A key goal of investigating predator-prey interactions involves determining prey inter- and intra-specific diversity, dietary proportions, and abundances or biomass consumed by the predator (reviewed by Pompanon et al., 2012), while achieving reliable detection of predation (Deagle et al., 2005). Developments in eDNA extraction and metabarcoding techniques are demonstrating reliability for this level of environmental monitoring by: (i) identifying prey at high taxonomic resolution and when missed by other methods (Bowen and Iverson, 2013; Stat et al., 2019); (ii) estimating dietary proportions from relative genetic importance, and reconstructing approximate biomass consumed through genetic abundance data (Deagle et al., 2019); (iii) identifying species’ intraspecific genetic diversity within environmental samples for wildlife forensics and population estimation (Sigsgaard et al., 2016; Seersholm et al., 2018; Tsuji et al., 2020).
In southeastern Australia, the recovery of long-nosed fur seals (Arctocephalus forsteri) could cumulatively threaten populations of little penguins (Eudyptula minor) in addition to other known stressors (Reinhold et al., 2022). Both species are federally protected and garner significant cultural and conservation value (Introduced by Bill Heffernan, Ian Campbell., 1975 and Introduced by Bill Heffernan, Ian Campbell., 1999), albeit listed as ‘Least Concern’ by the IUCN Redlist (IUCN, 2020). Little penguins are a popular tourist attraction and valued species to communities across southern Australia (Tisdell and Wilson, 2012). Little penguin populations are estimated at 470,000 individuals (BirdLife International, 2021); yet 60% of sites have unknown population trends, 29% of colonies are declining, and most persist on offshore islands in southern Australia and are difficult to census (BirdLife International, 2021). Little penguins forage at sea but breed on land, making them susceptible to threats from both environments. Major contributors to declines in little penguin populations include terrestrial threats of: (i) changes in land-use and predators introduced by European settlers (Dann, 1991; Kirkwood et al., 2014) and (ii) susceptibility to hyperthermia during more frequent terrestrial heat waves (Tworkowski et al. (2018); Marker, PhD Thesis, 2016; also seen in African penguins, Welman and Pichegru, 2023). At sea, ocean warming and large-scale changes to food webs caused by climate change as well as competition with fisheries are threatening processes of concern (Ropert-Coudert et al., 2019).
The fur seals were decimated by fur trade through the 1800’s and culling into the late 1900’s due to perceived competition for resources with fishers (Shaughnessy, 1999). Long-nosed fur seals have experienced range-wide increasing population trends, reported at 97,200 in the state of South Australia (2013–14 census; Shaughnessy et al., 2015) where an estimated 83% of their recorded pup production occurs. While the original population size is unknown, harvesting records suggest that the current population represents a small fraction of that prior to European colonization and exploitation (Ling, 2014). The recovery of the species in Australia continues to conflict with some communities and fisheries (Shaughnessy et al., 2003; Goldsworthy and Page, 2007; Cummings et al., 2019) due to their potential predation impacts to prey species. While it is realistic to expect high levels of predation to affect prey population size or behavior (Visser et al., 2008), recurring, popular discussion to cull the long-nosed fur seal population in South Australia have grown despite an absence of quantitative information (Goldsworthy et al., 2019).
Little penguins and other seabirds were identified in juvenile, sub-adult, and adult male long-nosed fur seal diets, at two locations in southern Australia and at low occurrence frequencies (Page et al., 2005; Hardy et al., 2017; Goldsworthy et al., 2019). Across several sites in Bass Strait and Eastern Victoria, long-nosed fur seals were more likely to predate little penguins originating from sites in closest proximity to them (Reinhold et al., 2022). However, beyond the presence of diagnostic remains in scat samples, we fundamentally lacked any further quantitative information on this predator-prey interaction, particularly for ‘unquantifiable remains’, such as feathers and when prey are not consumed whole. Page et al. (2005) proposed a single scat containing feathers was equivalent to a single bird consumed; however, mass-balanced trophodynamic modelling in the Great Australian Bight marine ecosystem suggested that this likely overestimated predation and that multiple scats containing feathers could also represent a single bird consumed (Goldsworthy et al., 2013). This issue affects all predation systems where prey are not consumed whole, or where diagnostic hard parts do not survive digestion, and where they are lacking in the first place for soft-bodied animals; yet traditional morphological analyses of stomach or gut contents remains the standard in predator diet analyses.
To assess predation incidence on little penguins and seabirds across southeastern Australia, we apply two complementary surveillance techniques simultaneously, morphometric (prey hard-part) and avian-specific DNA metabarcoding (genetic) assays, to long-nosed fur seal scats. We consider these techniques complementary rather than overlapping, in that they are designed to detect evidence of predation from different sources of tissues when applied simultaneously to bulk sample processing, namely soft vs. hard remains of prey which are known to be differentially affected by digestion (Casper et al., 2007; Tollit et al., 2009; Jeanniard-du-Dot et al., 2017). Of note, it is important to understand that when hard parts are present in samples there are known differences in the quantities of DNA that can be obtained from chitinous compared to soft tissues (McDonald and Griffith, 2011). Therefore, (i) we compare overall seabird and little penguin detection rates across groups of samples, using hard-part and genetic assays; (ii) we investigate the diversity and relative importance of seabirds consumed by long-nosed fur seals apparent from both assays; and (iii) with the output of the genetic assay, we explore a minimum estimate of penguin abundance consumed by analyzing mitochondrial haplotype diversity among little penguin DNA obtained.
Methods
Key terminology & definitions
The goal of this study is to provide fully leveraged information from diet analyses which practitioners can use to make conservation and management decisions. To this end, it is important to clarify several terms and metrics reported in this study, for ease of understanding of the methods and results and their recommendations.
Regarding assays used, we refer to prey “hard parts” when describing their morphological remains, and to “hard-part” or “morphological” analyses when describing the assay technique that examines their morphological remains (see Jeanniard-du-Dot et al., 2017). We refer to “DNA-based” or “genetic” analyses when describing the assay technique that examines prey DNA extracted and sequenced from samples.
While incidence, frequency and occurrence are synonyms in the English language, we use “predation incidence” when discussing the impacts of our findings, because seabird predation by long-nosed fur seals to date has been incidental and infrequent (Page et al., 2005; Hardy et al., 2017; Goldsworthy et al., 2019). We use the frequency at which seabirds and little penguins were detected from two assay techniques to calculate the “frequency of occurrence” of these taxa across the range of samples to inform our reported range of predation incidence. There is concern that to refer to predation “frequency” implies that it is “frequent”, and we emphasize that this distinction requires additional monitoring of the prevalence of the patterns identified in this study.
As commonly practiced in diet studies, we report the “detection” of seabirds and little penguin remains when comparing the results of the genetic and morphological assays, and “occurrence” in comparison to other covariates (i.e., location) and studies. We note that diet studies commonly calculate frequency of occurrence based on the number of samples in which prey taxa were detected, and all studies understand that this is simply a representation of the true frequency of occurrence or incidence of predation. Finally, in addition to occurrence information, we report the relative and total abundances of prey sequences (Supplementary Information). This is because experiments performed on seals have shown useful relationships between the biomass of prey consumed and the relative sequence abundance, as well as the level of importance of prey species (Deagle et al., 2005; Thomas et al., 2014, 2016; Deagle et al., 2019), and highlight the potential for this information to be useful in the future, as further experiments enable the development of correction factors.
Sample collection
Individual predator scat samples (n = 99) were collected across multiple time points from four long-nosed fur seal breeding colonies in Victorian Bass Strait and New South Wales (NSW), southeastern Australia (Figures 1, 2). Pup abundances are illustrated as a conventional proxy for relative seal population abundance (Figure 1; Appendix S1.1). Most samples were collected from the two larger colonies, Barunguba and Cape Bridgewater, in the Austral spring (September) 2016 and summer (January) 2017, with additional samples included from spring 2015 and summer 2016 at Cape Bridgewater. Samples from Gabo Island were collected from summer 2017. One sample was opportunistically collected from a lactating female at Deen Maar Island and included in assays. Sample sizes resulted from balancing adequate replication per site with availability of fresh samples.
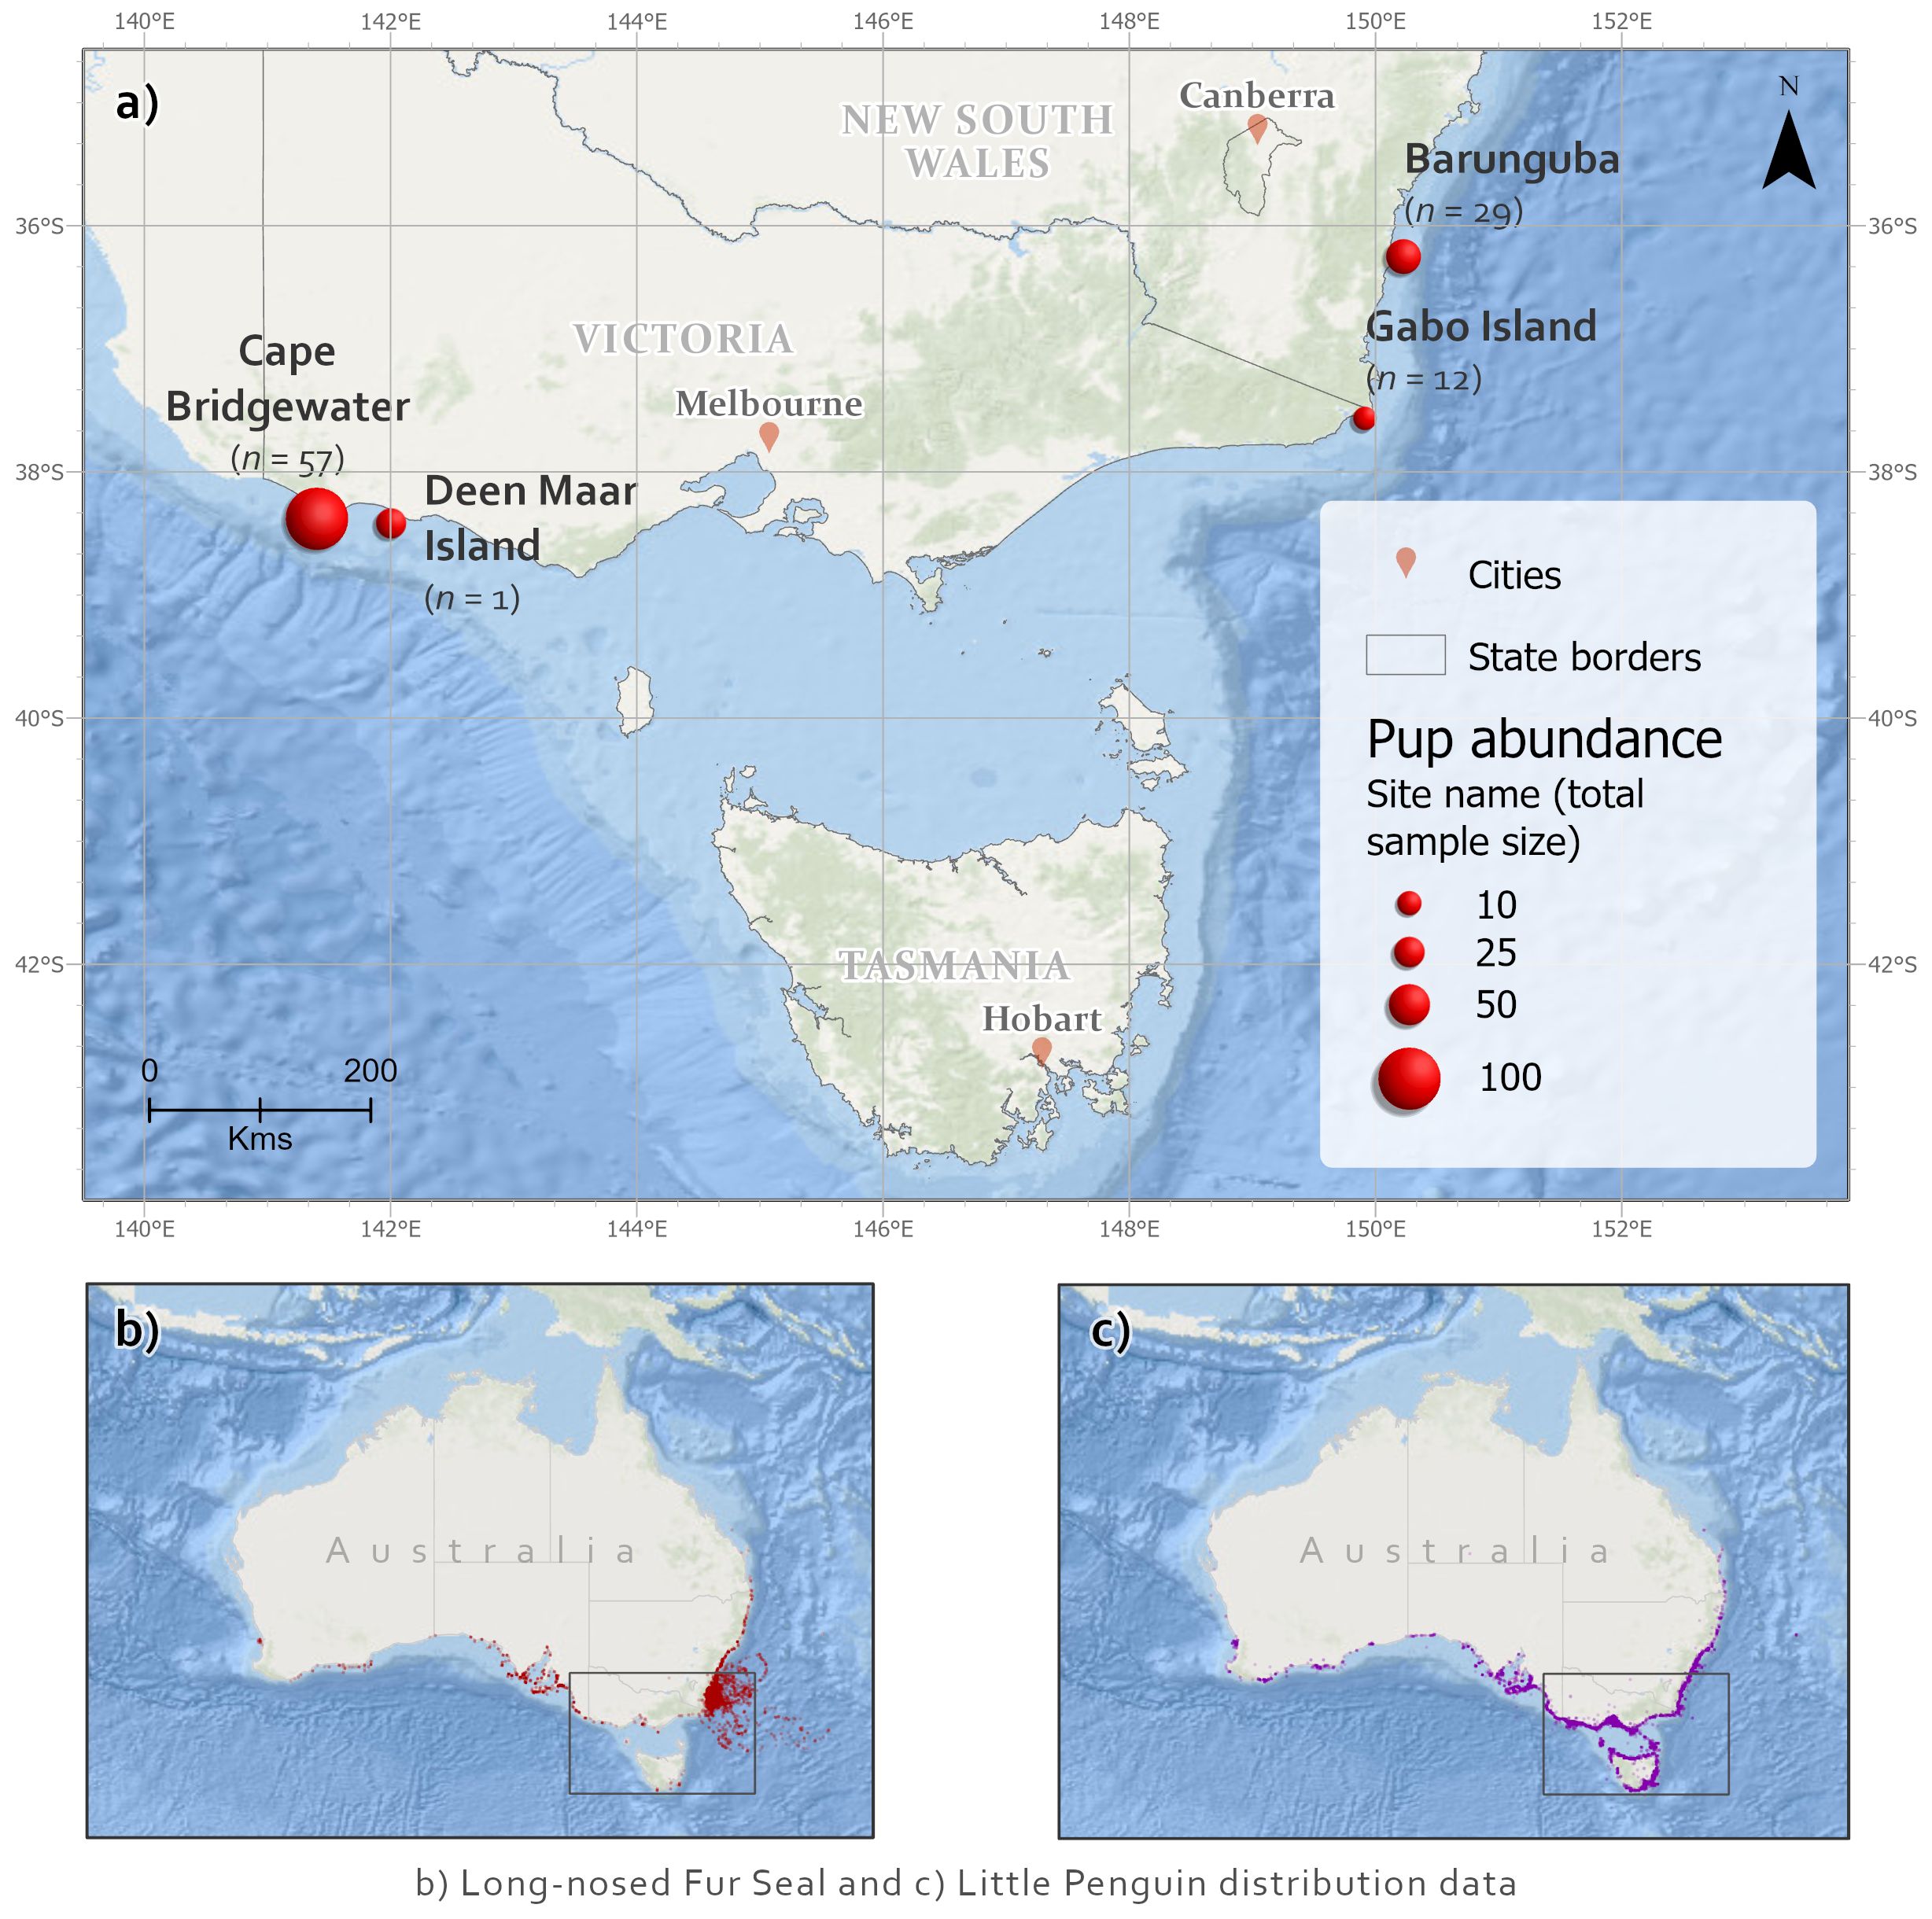
Figure 1 (A) Long-nosed fur seal scat collection sites (n = total number of samples), including pup abundances for sampling locations (McIntosh et al., 2014) as an index of seal population relative importance of sites. Sampled sites were Cape Bridgewater (38.3013° S, 141.4062° E) and nearby Deen Maar Island (formerly Lady Julia Percy Island, 38.4161° S, 142.0038° E) from western Bass Strait, Victoria; Gabo Island in eastern Bass Strait, Victoria (37.5649° S, 149.9133° E); and Barunguba (formerly known as Montague Island 36.2510° S, 150.2270° E) at the northeastern breeding range in New South Wales (NSW). Species distributions shown for (B) long-nosed fur seals and (C) little penguins (data from ALA, 2019).
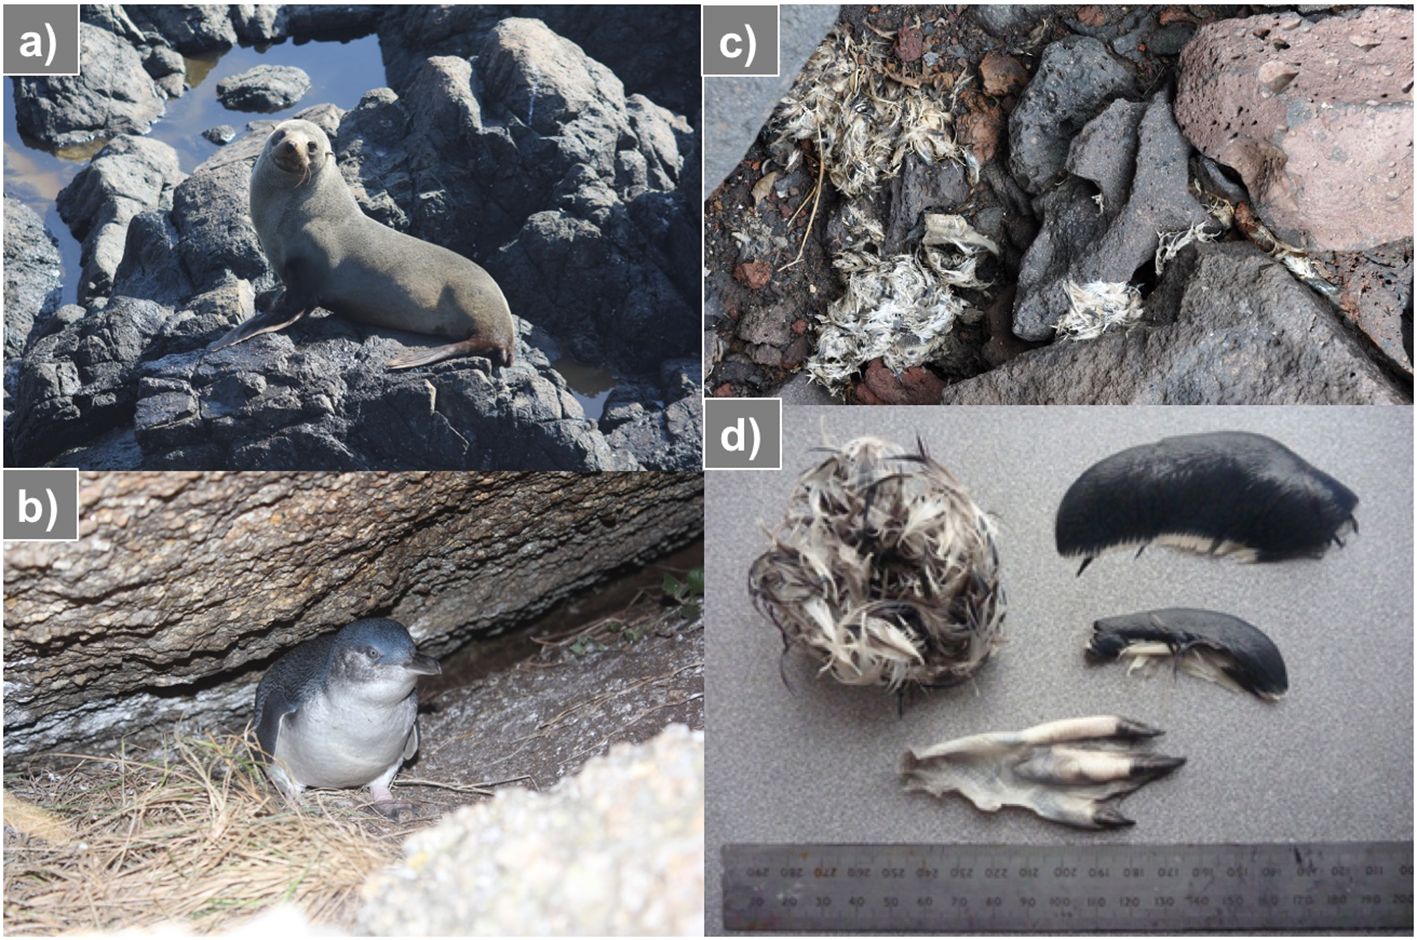
Figure 2 (A) A long-nosed fur seal, Arctocephalus forsteri, from Barunguba, NSW; (B) the little penguin, Eudyptula minor, often burrowing near fur seal colonies; (C, D) seabird remains are conspicuous at long-nosed fur seal haul-outs and colonies, among scats and regurgitates.
Whole and moist scats were sampled to minimize bias from differential DNA degradation or partial loss of material (similar to Deagle et al., 2009). Whole scats were thoroughly mixed with individual disposable spatulas at point of collection and a 2 mL subsample was taken from each field-homogenized scat for genetic analyses of prey tissues (Hardy et al., 2017). The remaining whole scats were collected for analyses of morphological prey remains, using individual, zip-lock bags. Samples were stored within hours of collection between -10° and -20°C in portable freezers (WAECO) for up to 7 d in the field and transferred to -20°C freezer facilities.
Identification of seabird morphological and genetic remains
In total, 99 fecal DNA sample extracts were processed using morphological and genetic assays. For the morphological assay, all prey items recovered from scat samples were identified from hard parts using the methods described by Page et al. (2005). Birds were identified using feathers and other remains such as feet, flippers, and heads (Figure 2, Appendix S1.2).
For the genetic assay, prey DNA extractions used 250 mg of fecal subsamples and MoBio PowerSoil® DNA Isolation Kits (now QIAGEN: www.qiagen.com) effective for DNA extraction from highly inhibited and mixed samples of fecal origin (similar to Carroll et al., 2019), with modifications to the manufacturer’s instructions made to optimize DNA extraction. These included an overnight digestion phase in cell lysis buffer (C2 solution) at 4°C, and the incubation step in inhibitor removal solution was extended from 5 to 60 minutes at 4°C. No host inhibitor step was required because the assays used do not detect mammals. Target DNA was then eluted in 100µL of 10 mM Tris buffer, MoBio PowerSoil® C6 solution, (www.qiagen.com) and stored at -20°C. DNA extract concentrations were measured and verified using a NanoDrop™ Spectrophotometer (www.thermofisher.com/). For use in positive controls and to test primer specificity, nuclear DNA was extracted from the center of the muscle tissue matrix (25 mg) of a domestic chicken (Gallus gallus domesticus) and a little penguin carcass obtained by Phillip Island Nature Parks, using Bioline Isolate II Genomic DNA Kits (www.bioline.com/us/) as per manufacturer instructions. A dedicated controlled eDNA laboratory was used at RMIT University, Bundoora, Victoria, with separate spaces and rooms designated for the physical separation of eDNA extraction, pre-PCR preparations and post-PCR procedures. Positive and negative controls (extraction and PCR) were used to identify potential contamination at each laboratory procedural step from DNA extraction to diagnostic PCR steps.
The 99 fecal DNA sample extracts were screened in duplicate and at two DNA concentrations (neat and 1:10 dilutions), alongside extraction blanks (n = 5), PCR blanks (n = 4), and positive controls (n = 2) by diagnostic endpoint PCR (dPCR) using the Bird12sa/h assay (forward 5’ CTGGGATTAGATACCCCACTAT to 3’, reverse 5’ CCTTGACCTGTCTTGTTAGC to 3’), a conservative primer ‘Bird12sa/h’ targeting a ~230 base pair (bp) fragment of the avian 12S ribosomal RNA (rRNA) gene (Cooper, 1994) (Table 1). PCRs were run on Bio Rad C1000 Touch thermal cycler using cycling steps outlined in Table S2, and using the AmpliTaq Gold® 360 Master Mix using reagents and concentrations provided by the manufacturers. All duplicate dPCR products were run on 1.5% agarose gels to determine the presence/absence of amplified target bird DNA. We obtained optimal amplification and low inhibition from neat DNA concentrations.

Table 1 Primers used, target taxa and genes, as well as designer references.
Of note, we conducted an initial pilot study using the Bird12sa/h and a second previously tested assay also for mitochondrial DNA, the AWCF1/R6 primer pair targets a longer fragment (~850 bp) of the cytochrome c oxidase 1 gene (COI) (Patel et al., 2010) (Table-S1, S2, described in Appendix S1.3). Both primers were tested using both positive controls (little penguin and chicken DNA) and run on a gradient PCR from 52–58°C (with 1°C increments) to optimize the annealing temperature. We selected 57°C for the Bird12sa/h primer (Cooper, 1994), and 54°C for AWCF1/R6 (Patel et al., 2010) as the optimal temperature for PCR for these primers and to further test their amplification success rates on a subset of our fecal DNA samples.
The Bird12sa/h assay targeting a shorter gene fragment was more sensitive than the COI primer targeting a long fragment environmental DNA, which was expected given the degraded nature of DNA found in fecal samples. Additionally, the Bird12sa/h primer produced a similar proportion of positive results for seabird eDNA to the overall detection rates of diagnostic seabird hard-parts in samples (~30%), while detection rates using COI primer were very low (~5% of samples) in our samples. Consequently, due to time constraints and costs, we chose to continue with only the Bird 12sa/h assay and discuss the availability and use of multiple specific genetic assaying tools in avian eDNA. Finally, because both primers are avian specific, there was no need to inhibit the host DNA (Cooper, 1994; Berry et al., 2017). We share this information to assist future studies in primer selection and optimization.
Using the avian specific Bird12sa/h assay, a total of 32 samples (of 99) showed target amplicons in both or a single duplicate at neat DNA concentration, all extraction and PCR controls were negative. DNA extracts of the 32 samples that tested positive for birds, and two extraction blanks and one positive control (n = 35 samples for sequencing) were therefore sent for quantitative PCR (qPCR), cleanup, sample-based rarefaction and extrapolation sampling curves, appropriate sequencing depth (< 10,000 reads per sample) and next generation sequencing performed on Illumina Miseq by Ramaciotti Centre for Genomics (RCG), University of New South Wales. There, a single-step fusion tagging PCR procedure was used to attach and assign unique MID (Multiplex IDentifier) tag combinations, next generation sequencing (NGS) adaptors and the Bird12sa/h assay. Amplicons were purified and blended at RCG in equimolar concentrations to form a library, which was sequenced with a 150 bp paired-end sequencing kit (Illumina Miseq v2 Nano 150 bp). We used the single-step fusion PCR procedure over the two-step PCR approach to reduce the risk of ‘tag jumping’ during the second amplification step where MID tags are assigned (Schnell et al., 2015; Taberlet et al., 2018). This type of error is difficult to detect and risks cross-contamination of amplified DNA among samples between initial PCR products and terminal PCR products. Single-step fusion PCR procedures therefore provide us with the least risk of sample cross-contamination over other procedures. After sequencing, samples were ‘demultiplexed’ and assigned to the correct original sample by their individual MID tags.
We used Geneious R8.1.5 (Kearse et al., 2012) to merge the paired-end forward and reverse sequences (2x ~150 bp fragments, with overlap of 70 bp) and retain only those with exact flanking MID tags, primers, and adapter sequences. Once paired, the MID tags, NGS adaptor sequences and the Bird12sa/h forward and reverse primers, were subsequently trimmed, leaving the complete target sequences for each sample. Sequences were discarded if they did not contain exact matches to both the forward and reverse PCR primers, tags, and adaptor sequences, failed to pair, or were > 10% shorter than the primer product length (expected 220 bp, discarded below 200 bp) (as in Berry et al., 2017, and Hardy et al., 2017).
These sequences were quality filtered and clustered into molecular operational taxonomic units (OTUs) using the UPARSE algorithm in USEARCH (Edgar, 2010; Edgar and Flyvbjerg, 2015) and using a 97% similarity criterion (as in Berry et al., 2017). Illumina’s Miseq has been found to have an error rate of about 0.1% (Fox et al., 2014), we chose a conservative 1% cut off of aggregated 100% identical, unique nucleotide sequences (hereafter ‘unique sequences’) to further minimizes the risk of erroneous sequences and false positives. We then mapped total filtered sequences (hereafter retained reads or sequences) for these identified OTUs back to individual samples. This can result in some samples containing very low to trace amounts of retained target sequences of high quality that belong to a more abundant cluster from the pool across samples.
Consensus, representative sequences for each out were queried against the National Center for Biotechnology Information’s (NCBI) GenBank nucleotide database using the algorithm BLASTn (Basic Local Alignment Search Tool; Benson et al., 2005). The resulting queried sequences were assigned to taxa, following criteria and taxonomic reference databases outlined in Hardy et al. (2017) and Appendix S1.4 (Table S3). These criteria maximized confidence in making a taxonomic identification by remaining conservative in our assignments (i.e., selecting an identification at genus level) where multiple species were found to be closely related on the Bird12s gene, or where other likely and related prey lacked genetic reference material, which could lead to false assignment to a genetically related taxon with representative genetic reference material. All the identified seabirds occurred within the geographic ranges of the LNFS and are considered viable prey species for LNFS.
Haplotype polymorphism analysis
As a species of conservation concern and key avian prey species, we sought to identify a minimum number of individual little penguins by exploring mtDNA haplotypes from 12S rRNA sequences obtained for little penguins. While dependent on sequence fidelity, such approaches have been used to explore intraspecific diversity in genetic data (similar to Seersholm et al., 2018). We imported the retained sequences for all seabirds, produced just prior to OTU clustering, we matched these sequences in relation to sample identifiers and formed these into clusters of unique sequences in Geneious (Kearse et al., 2012).
From each of the penguin DNA-abundant samples (Table S4), we conservatively selected the top 1–3 most abundant sequences to form the basis a conservative set of haplotypes identified in each sample and each represented > 5% of the total sequence abundance within each sample, and each diverging by 2–8 bases. Only one haplotype diverged from another by a single base, due to sequence abundance this would not have occurred due to sequencing error, and thus represents a truly divergent sequence cluster. We chose this conservative and manual selection method of haplotype identification over an in-depth sequence denoising method that would have maximized the identification of true haplotypes (see Nearing et al., 2018), due to the small sample size of penguin-positive and abundant penguin-DNA containing samples. We present a conservative number of individual haplotypes, while it is possible that additional true haplotypes exist within the data and were missed using this approach.
We produced a minimum spanning haplotype network using the software PopART (Leigh and Bryant, 2015) from an alignment of these identified penguin sequences to visualize relationships between haplotypes consumed, and between samples from the different locations sampled. All samples containing little penguin DNA, including lower abundance samples, were then searched for the presence of these five identified haplotypes. We estimated the number of penguins likely consumed based on the number of haplotypes within each sample. As samples were collected across multiple days from each location and sampling time, we treated each sample as from distinct predators or predation events.
Statistical analyses
To account for different sampling times and locations, samples were assigned one of seven unique grouping factors that combined location and time (e.g., Barunguba, January 2017). The single scat sample collected from Deen Maar Island was not included in statistical tests, but results were reported for future comparisons. The presence of seabird and specifically little penguin remains across samples using different dietary assay techniques (hard-part vs. DNA; Table S6, Appendix S2) were examined using two generalized linear models (GLMs), constructed in the stats package in R version 4.0.3 (R Core Team, 2020). A binomial error distribution for presence-absence data was used and additive term included to account for long-nosed fur seal group (location and time). Model fit was assessed using deviance explained and variable significance (p < 0.05).
Results
Bioinformatics results
From initial bioinformatic processing steps (sequence demultiplexing, read pairing and trimming barcodes), we obtained 64,361 individual sequences and 7,370 unique sequences. Following sequence quality filtering to 1% (n < 74) of the total abundance of unique sequences (n = 7,370) and clustering to OTUs (97% similarity). This filtering and quality control procedure resulted in 35,498 retained sequences, and 5 OTUs (of the thousands of unique sequences that were combined to within 97% similarity), for 25 samples.
Comparing diagnostic hard-part and genetic assays
Overall, the detection rates of seabirds and specifically penguins were statistically similar for each method (GLM seabird detection ~ metric: p-value = 0.6483; GLM penguin detection ~ metric: p-value = 0.2003; Table S6). The assays tended to detect seabird remains in different samples, with an overlap in detection of the same taxon using both assays for a third of the seabird positive samples, which was to be expected when using assays that target different tissue types (soft vs. hard parts) and with different passage times through predation digestion. Notably, DNA metabarcoding offered additional information: (i) in detecting multiple prey taxa within a single scat that never occurred with the hard-part methods (Figure 3), (ii) total and relative abundance information for amounts of DNA recovered (Figures S1, 4, Table S4), and (iii) exploration of within-sample genetic diversity assessed here for little penguin 12S rRNA enabling the estimation of a conservative number of predated penguins (Figure 5, Table S5).
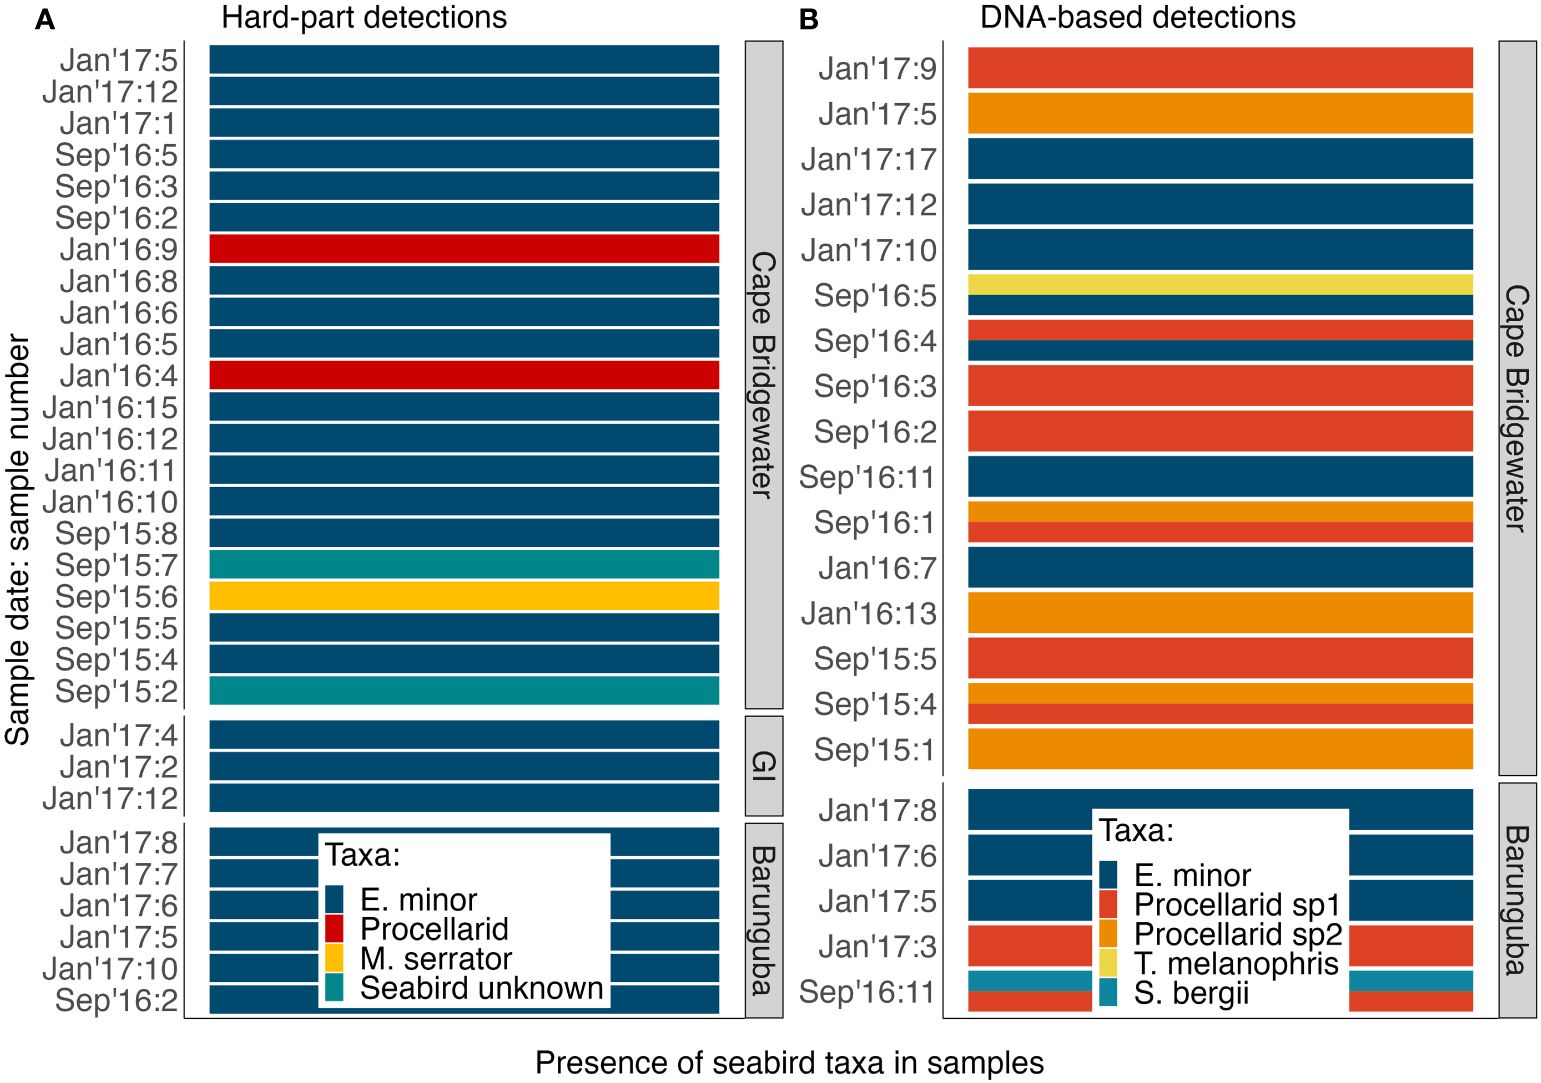
Figure 3 The diversity of seabirds identified in long-nosed fur seal samples: (A) using hard-part analyses (n = 29) and (B) using DNA metabarcoding (n = 21). GI, Gabo Island.
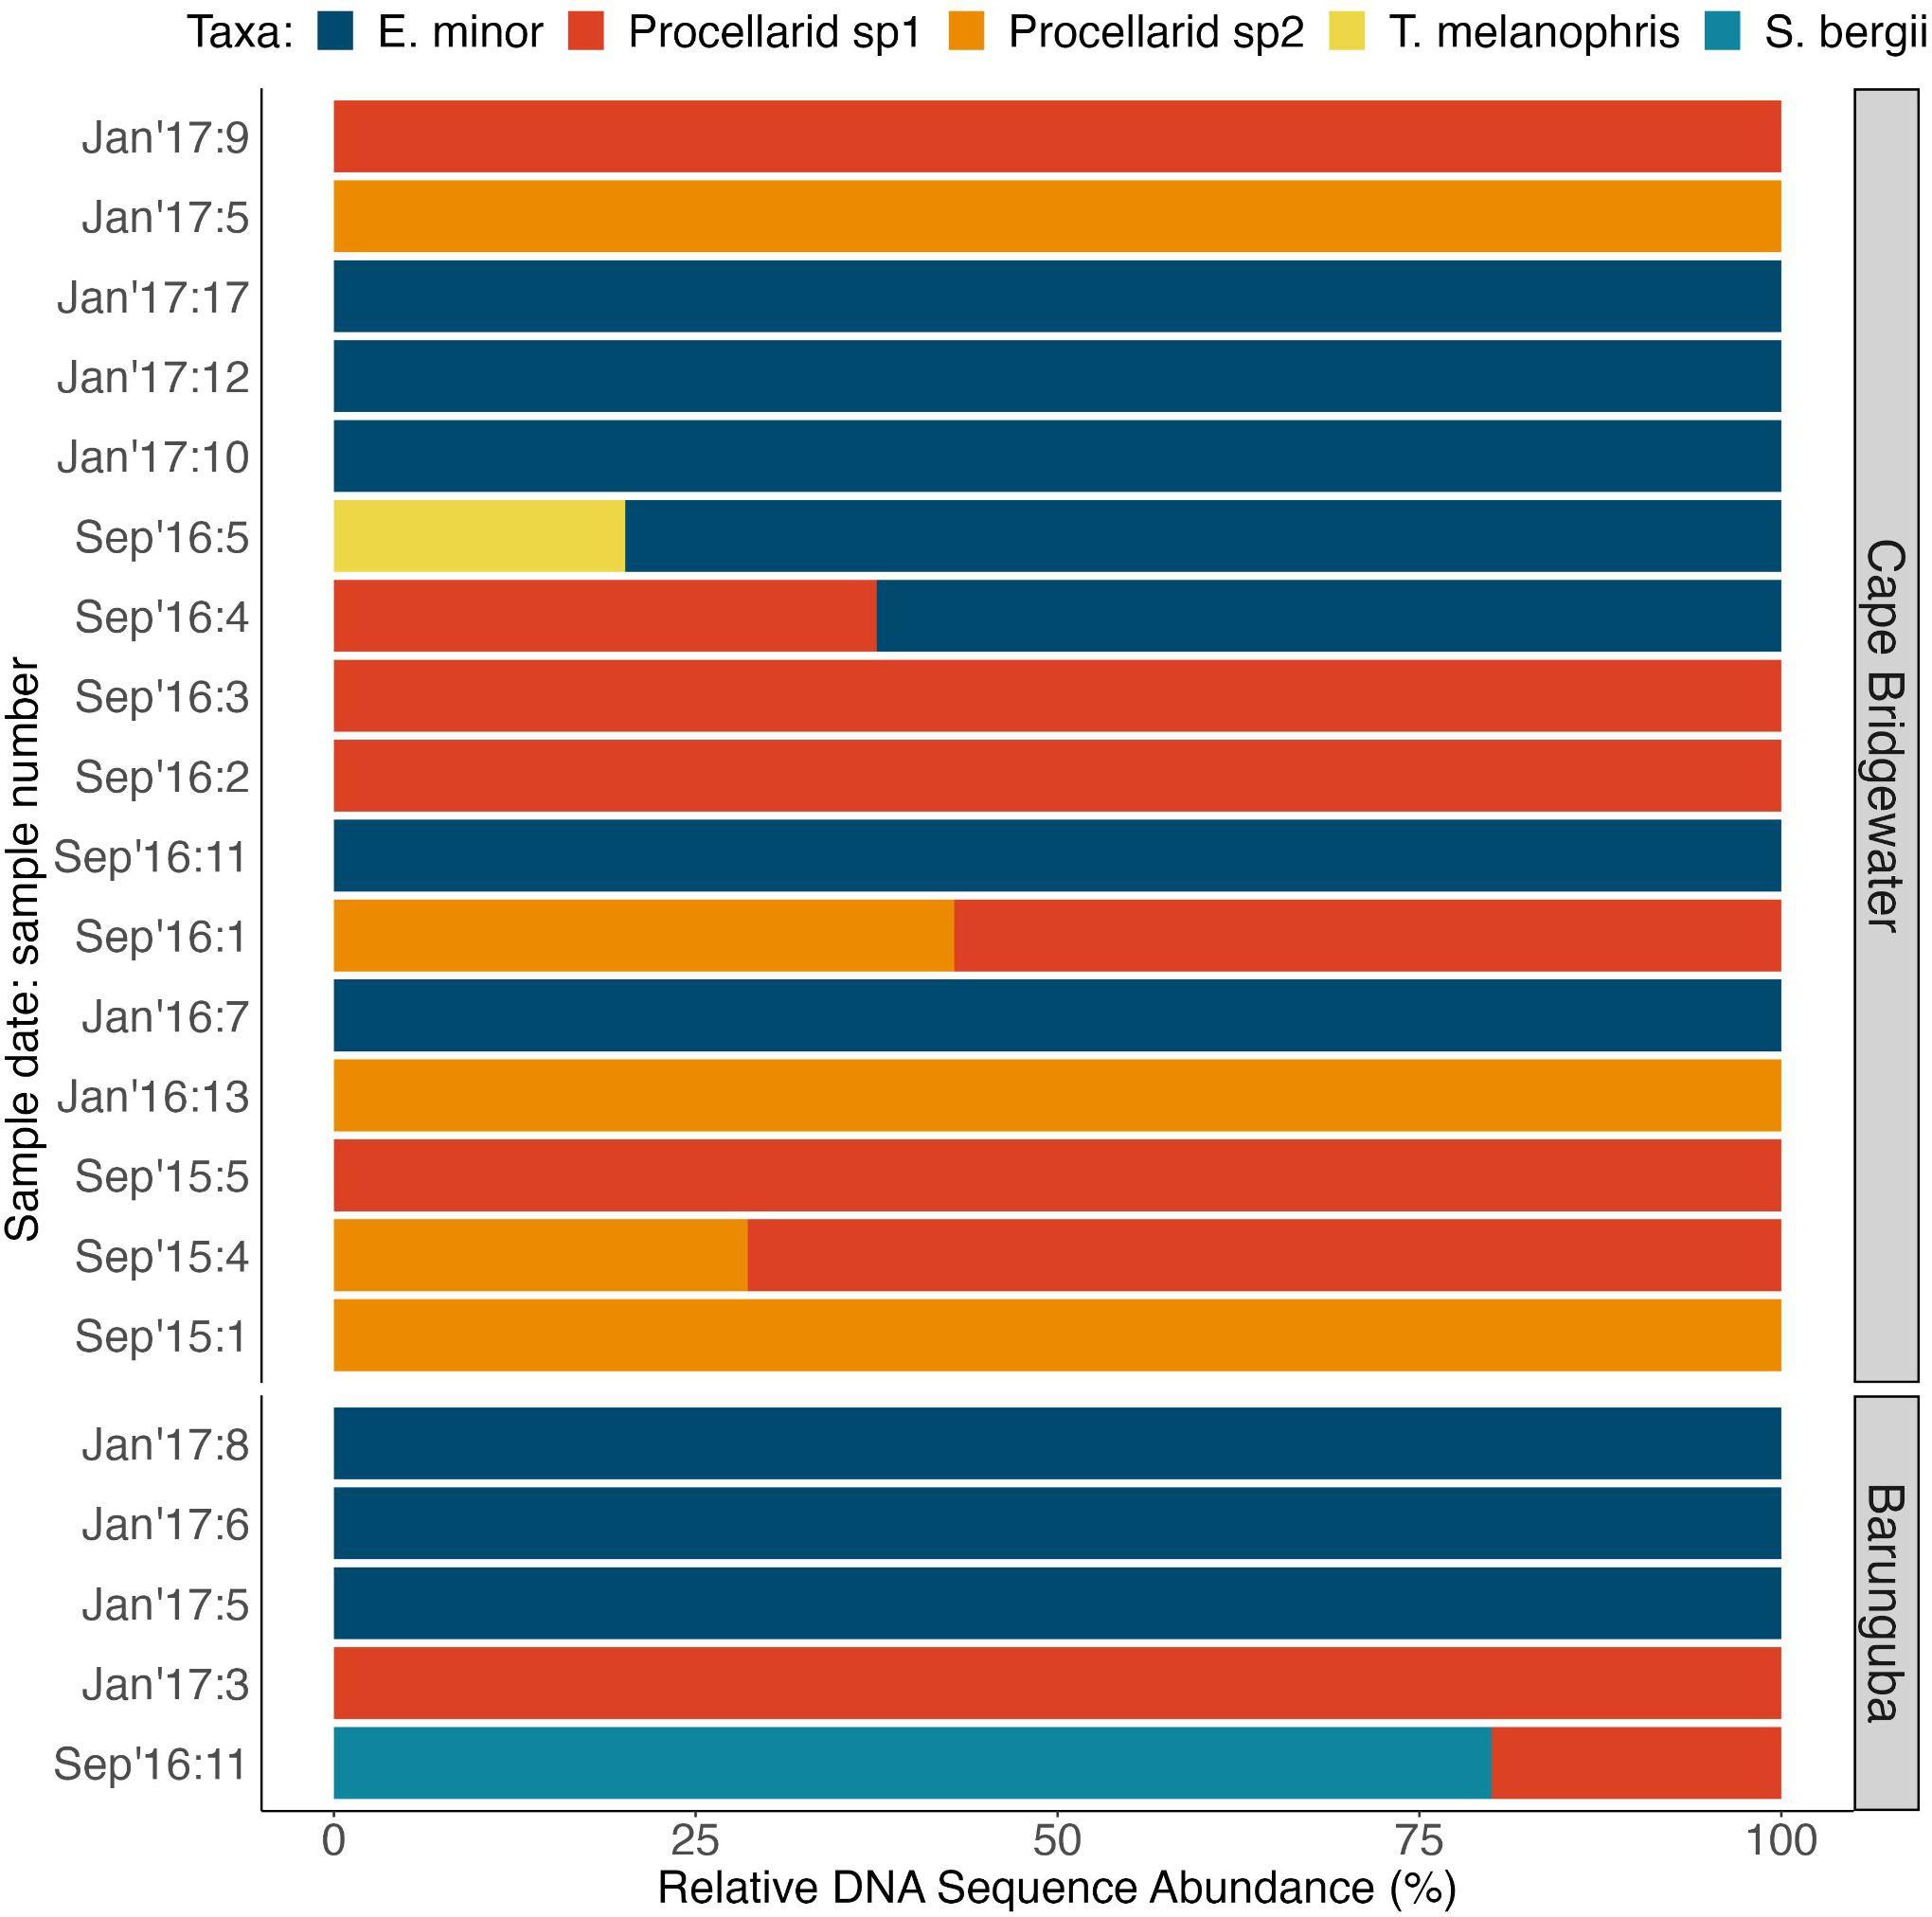
Figure 4 Relative genetic contribution within seabird-positive long-nosed fur seal samples (n = 21) of seabird taxa identified and illustrated as a proportion of DNA abundance recovered for each taxon within each sample, and for locations and sampling times.
Seabirds were detected in 29.3% (n = 29) of samples using diagnostic hard-parts, and 21.2% (n = 21) of samples using DNA metabarcoding (Figure 6A). Most of these detections were little penguins, detected in 25.3% (n = 25) of samples with hard-parts and 10.1% (n = 10) of samples with DNA (Figure 6B). These detection rates, when calculated across all samples amount to reporting frequency of occurrence, provide the upper estimate of predation incidence in long-nosed fur seal samples for seabirds and little penguins. All positive detections were obtained after quality control and filtering; despite this, the majority of DNA sequences for all seabird taxa were identified in 9 out of 21 seabird-positive samples (Figures 6, S1, Table S4). Additionally out of the 21 seabird-positive samples, 10 were penguin-positive, while 6 contained the majority of the penguin DNA (Figures 6, S1, Table S4). This provided a lower and more conservative estimate for predation of seabirds in 9.1% and little penguins in 6.1%, across 99 samples.
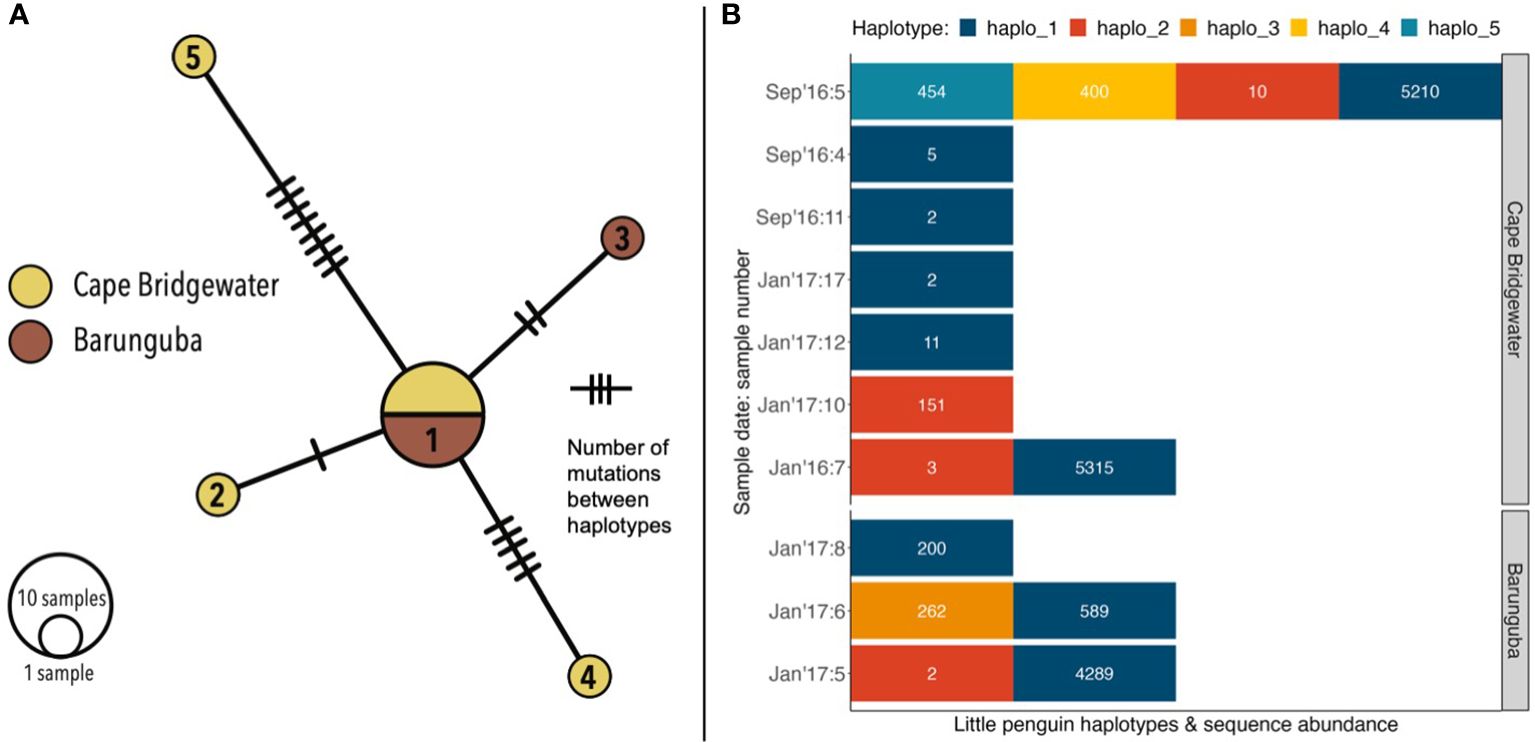
Figure 5 Little penguin genetic diversity detected from sequences from the avian specific Bird12sa/h assay (for ~230 bp 12S rRNA gene): (A) presented as a minimum spanning network of five distinct haplotypes, and (B) number of haplotypes contained within each penguin-positive sample, including haplotype sequence abundances within samples.
While detection rates were statistically similar for both methods for seabirds and penguins, there was greater variability across locations using hard-parts compared to DNA (Table S6, Figures S2, S3). Minor, albeit statistically significant, differences were observed across sampling groups for seabird occurrences (binomial GLM for seabird occurrence ~ location: p-value = 0.017; Figure S3A, Table S6), but not for penguins (binomial GLM for penguin occurrence ~ location: p-value = 0.2291; Figure S3B, Table S6). Occurrence variability was high across sampling locations, times and methods used (Figures S2, S3). Little penguins were detected by the hard-part assay from Gabo Island samples, confirming predation occurs at this location, however only a few sequences of little penguin DNA were detected at Gabo Island and Deen Maar Island, and these sequences did not pass DNA quality filtering.
Seabird diversity in long-nosed fur seal diets
DNA metabarcoding resulted in the detection of taxonomic mixtures in scat samples compared to hard-part analysis (Figure 3), by detecting 2 distinct seabird taxa in 5 of the samples. Using hard-part analysis, no sample was found to contain more than one identified bird taxon (Figure 3A). Little penguins were the main seabird prey species detected using both analyses (Figure 3), and this was reflected in all datasets obtained from DNA (Figure 3), with greater total abundance of sequences (Figure S1) and greater relative sequence abundance (Figure 4) than any other seabird prey identified.
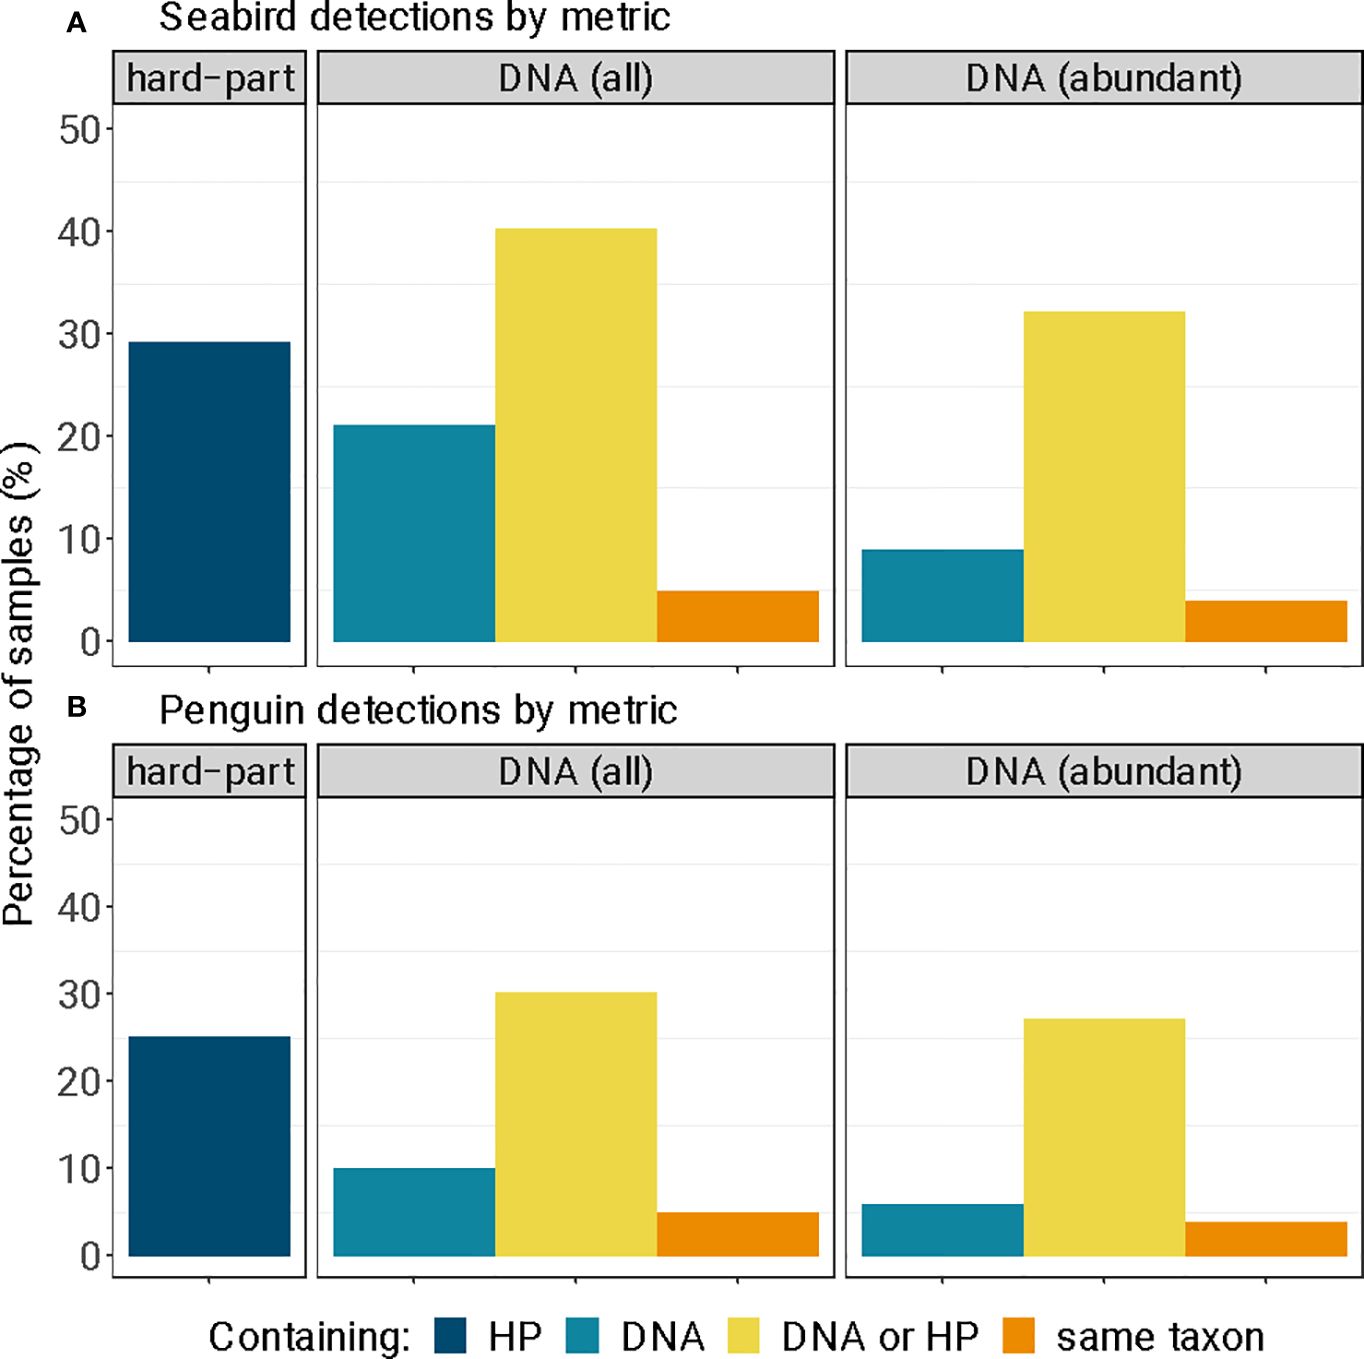
Figure 6 Detections of (A) seabird and (B) little penguin diagnostic hard-parts (‘HP’) and DNA (‘DNA’), as a percentage of all long-nosed fur seal samples (n = 99). We report all genetic sequences obtained from standard sequence quality control and filtering ‘DNA (all)’, and for samples that contained large sequence quantities of sequences ‘DNA (abundant)’ (> 90% of filtered sequences); and the number of samples that contained both the morphological and genetic remains of the same seabird (‘same taxon’).
Hard-part analysis revealed two other taxa in addition to little penguins: a shearwater family group (Procellaridae spp., n = 2), and Australasian gannet (Morus serrator, n = 1) (Figure 3). DNA metabarcoding detected abundant DNA from two distinct shearwater taxa, also identified at family-level, Procellarid spp. 1 in 9.1% (n = 9) and Procellarid spp. 2 in 5% (n = 5) and of samples (Tables S3, S4, Appendix S2). Black-browed albatross (Thalassarche melanophris) and greater crested tern (Sterna bergii) were each detected once (Figure 3, Tables S3, S4). Importantly, parallel use of both genetic and hard-part analyses revealed a greater diversity of taxa than either method alone.
Towards quantifying little penguin consumption
From the six scats containing abundant penguin DNA (Table S4), a total of five mtDNA haplotypes were identified in samples from Cape Bridgewater (haplotypes 1–2 and 4–5) and Barunguba (haplotypes 1–3) (Figure 5A). From each of the penguin DNA-abundant samples, we selected the most abundant unique sequences to form the basis of the first two haplotypes (haplotypes 1 & 2). We then examined the abundance of the remaining sequences in each sample. Within the Sept16:5 sample there were two potential haplotypes (haplotypes 4 & 5), each had an abundance of 400 or more sequences. These two haplotypes were unlikely to be the result of error as they diverged from the most abundant sequences by 4 and 8 bases. The final haplotype selected (haplotype 3) was from the Jan17:6 sample. While this haplotype differed only by a single base from the most abundant sequence, the abundance of haplotype 3 (262) was almost half of that of the main haplotype in that sample; haplotype 1 (589). This sequence ratio indicates that haplotype 3 is not the result of sequencing error (Table S5).
Only haplotype 3 was unique to Barunguba, haplotypes 4 & 5 were unique to Cape Bridgewater and the remaining two haplotypes (1 & 2) were detected at both sites (Figure 5B). Haplotype 1 matched the 12s rRNA gene fragments of two independent penguin samples (MF370525, MK761006) from whole genomes from the same region (Sarker et al., 2017; Vianna et al., 2020). Across all ten penguin positive scat samples, six contained a single haplotype, three contained 2 haplotypes and one contained 4 haplotypes (Figure 5B). It was reasonable to assume that a fur seal could consume at least part of more than one penguin per feeding opportunity. Therefore, by taking two distinct genetic haplotypes present within a sample to represent at least two distinct individual birds consumed, we estimated at least 16 individual penguins were consumed across the 99 scat samples, from two sampling locations and multiple seasons.
Discussion
We provide an updated and nuanced predation incidence range for seabirds overall (9.1–29.3%) and little penguins (6.1–25.3%) in long-nosed fur seal diets based on detection rates of hard-part and genetic assays, as well as the detection rate of genetically abundant samples, expanding previous information on occurrence rates (2–13%) (Page et al., 2005; Hardy et al., 2017; Goldsworthy et al., 2019). We confirm that little penguins remain the most commonly consumed seabird by long-nosed fur seals in comparison to other avian taxa as detected by both assay types. Here, DNA metabarcoding also offered key advantages over morphological analysis – quantitative information on: (i) greater diversity discovery by detection of multiple prey taxa within a single scat sample, (ii) absolute and relative abundances of taxa recovered using DNA to provide more conservative and nuanced estimates of predation rates, and (iii) preliminary estimates of predation impact, likely involving at least 16 individual penguins, by exploring the spatial and temporal distribution of haplotypes.
Implications for long-nosed fur seal and little penguin interactions
Previous studies using either assay technique alone have identified little penguin remains at relatively low frequencies in relation to seals’ total diets (as a percentage of samples: 5.9% in Page et al., 2005, <2% in Hardy et al., 2017, ~13% in Goldsworthy et al., 2019). These past values are similar to the lower range of estimates observed here (9.1% of samples for seabirds, 6.1% for penguins), and which corresponded to the number of samples containing large quantities of prey DNA. However, the detection from hard–part remains (29.3% of samples for seabirds, and 25.3% for penguins) and the upper range of estimates from genetic remains (21.2% of samples for seabirds, and 10.1% for penguins) is possible and is concerning if further monitoring reveals increases in penguin consumption by long-nosed fur seals. We report this range of predation occurrence because, regardless of the assay used, the persistence of feathers or soft tissues in scats remains an area of research and development (Goldsworthy et al., 2019), as does the relationship between genetic information and quantity of prey consumed (Thomas et al., 2014; Deagle et al., 2019).
Improving confidence in the results of these assays requires longer-term replication of the work and ongoing monitoring of this wildlife conflict using multiple surveillance techniques, paired with experimentation (for example Reinhold et al., 2022) to ascertain the closest to reality estimate of consumption of a species of conservation concern. Notably, when using relative read abundance information, we provided a more conservative estimate of predation incidence based on samples that contained large quantities of DNA and thus likely to represent a fresher meal and more recent predation event. These estimates, of 6.1% of samples containing little penguins, were most similar to past results from hard-part analyses generated from much larger datasets (> 1000 samples, <5% of samples; Page et al., 2005).
DNA metabarcoding was useful in detecting taxonomic mixtures in scat samples, here containing up to 2 distinct seabird prey taxa compared to hard-part analysis that did not detect more than one prey taxon at a time, and for little penguins using haplotype polymorphism analyses – the potential number of individual penguins consumed. Multiple individual birds are impossible to distinguish accurately from feathers and the number of scats required to pass a single bird is equally hard to quantify in the field (Page et al., 2005; Goldsworthy et al., 2013). The genetic assay provided multiple types of quantitative information on penguins consumed with which to overcome this issue, including a relative read abundance metric that confirmed little penguins as the most common seabird prey and a conservative estimate of individual penguin intraspecific diversity.
Our results confirmed that most scats with penguin DNA (n = 6 out of 10) contained a single haplotype, however, we found that four scats contained multiple haplotypes, with up to 4 distinct genetic haplotypes, suggesting that long-nosed fur seals can consume not only multiple seabird taxa but also multiple penguins in a single foraging trip (or, given the time it takes for prey to traverse the gastrointestinal system, within about 48h of sampling). This result is more consistent with pinniped foraging ecology than a previous assumption that each scat containing feathers corresponded to a single bird (Page et al., 2005), because fur seals typically process large prey by shaking it and breaking it up at the surface and may predate multiple prey in a single foraging event (Mumma et al., 2016; Hocking et al., 2016). Such feeding behavior can also result in partial consumption of the prey item and incomplete consumption of diagnostic hard parts. Therefore using genetic tools to fully extract intraspecific genetic diversity within samples warrants further application (see Nearing et al., 2018). Specifically, using additional genetic assays that target long fragments of less conserved genes could enable greater detection of intra-specific genetic diversity than the conservative 12s ribosomal gene (Banks et al., 2002), the use of which in this study, may have produced an underestimate of the number of penguins that could have been consumed.
While not their preferred prey in comparison to cephalopods and fishes (Page et al., 2005; Goldsworthy et al., 2013; Hardy et al., 2017), it is entirely plausible for long-nosed fur seals which can weigh from 50–150 kg (McKenzie et al., 2007) to consume more than 4 individual little penguins (or parts of) weighing less than 1.5 kg (Williams, 1995). If little penguin predation becomes an important individual foraging strategy even for a fraction of long-nosed fur seal populations, this could have serious negative impacts for isolated penguin populations. In the context of recent crashes in little penguin colonies (Sutherland et al., 2022), these data signal a need for broader and increased monitoring of predation mortality to little penguins to inform conservation and management strategies. Predatory behaviors could be transmitted to other predator populations such as the Australian fur seal (A. pusillus pusillus) or Australian sea lions (Neophoca cinerea) which partially overlap in geographic ranges. Despite little (Deagle et al., 2009; McIntosh et al., 2006) to no (Berry et al., 2017) prior identification of little penguins in these species’ diets, prey switching could become a possibility in response to food web disruption under ocean warming and changes in prey availability (Kliska et al., 2022) and this could have cascading effects on penguin populations.
We note that two thirds of the LNFS samples did not contain seabird DNA or hard-parts, and likely consist of fishes and cephalopods, their more common prey (Hardy et al., 2017). Further research of their total diet is ongoing using additional primers to investigate the importance of the non-avian composition of long-nosed fur seal diets in southeastern Australia. Additionally, the impacts of long-nosed fur seal predation need to be considered and managed within the wider forum, ideally using up-to-date cumulative impact assessments for threats to little penguins. For little penguins and in other wildlife conflict situations, endemic predation is natural whereas habitat degradation, environmental change and invasive species are often more significant sources of impact to susceptible species (Hervieux et al., 2014; Marshall et al., 2016; Ropert-Coudert et al., 2019).
Important methodological considerations and improvements
We highlight that for all assays (i.e., morphological vs. genetic) and metrics (i.e., detections vs. relative abundance data), there are important biological and methodological constraints and biases to consider when attempting to estimate predation incidence (detection and frequency-based) and magnitude (impacted number of prey or biomass) in reality.
Deagle et al. (2019) simulated the impacts of biases from metrics reported on diet summaries from 20 independent studies, and this indicated that relative read abundance information often provided a more accurate and nuanced view of population-level diet than frequency of occurrence-based data, despite known recovery biases (i.e., such as from amplification bias) – thus highlighting the importance of reporting relative and total abundance data from the genetic assay. Experiments performed on seals have shown relationships between relative read abundance and the ranked importance of prey species, and correlations with biomass consumed such that it is possible to develop correction factors (Deagle et al., 2005; Thomas et al., 2014, 2016; Deagle et al., 2019). It may become relevant to develop genetic tissue correction factors through experimental diet studies (similar to Reinhold et al., 2022) for this wildlife conflict scenario. Therefore, publishing all sound information on predation of seabirds by long-nosed fur seals will be useful to future investigations of this species interaction scenario.
Notably, we report sequence abundances after they have passed stringent sequence quality filtering steps, including a stringent threshold for excluding sequences from the recommended 0.1% (Fox et al., 2014) to 1% of total sequence abundance. This also follows many conservative decisions for the entire pipeline, including the use of a custom single-step fusion PCR over two-step PCR which reduces the risk of sample cross-contamination at a risky point in the workflow, that of amplification (Schnell et al., 2015; Taberlet et al., 2018). DNA-based diet analysis studies crucially rely on and have reported quantitative and semi-quantitative results from genetic assays for decades (Deagle et al., 2005). However stringency also represents a significant loss of data on wildlife interactions (Deagle et al., 2013) and thus we likely excluded several true positives that may have occurred with low DNA-abundance.
Due to financial constraints, technical replicates for each sample were not used in this study, a common practice in wildlife research where budgets are limited. Reported diet diversity would likely be higher when using multiple replicates for samples, thus our detection rate of seabird species and little penguin occurrences would likely have been higher when covering a larger quantity of the scat or results in slightly different dietary proportions than what the predator consumed (Mata et al., 2019). Our final study limitation is the use of manual sample homogenization and partial sub-sampling, while very common in DNA metabarcoding studies in wildlife biology, it remains possible that not all seabird prey species were detected from these samples and that dietary proportion information would be improved from the use of multiple replicate sub-samples. An experimental improvement where costs remain limiting would be to pool multiple sub-sampler replicates prior to sequencing (Shirazi et al., 2021; Van den Bulcke et al., 2021).
As a species of conservation concern and public value, the distinct variation in little penguin metabarcodes obtained in this study, beyond that attributed to sequencing error, led us to explore how many individuals might be within the data (similar to Seersholm et al., 2018 and Tsuji et al., 2020). However, haplotype diversity on this locus was likely underestimated because the 12S ribosomal RNA is conserved within species (Banks et al., 2002), which we selected for its proven reliability in detecting interspecific variability across seabirds (Berry et al., 2017; Hardy et al., 2017). Targeting alternative markers (variable barcodes or microsatellites) could reveal greater genetic diversity, however we did not succeed with a COI barcode (Appendix S1.2) due to the scarcity of longer fragments of DNA in samples.
In this study, we identified five individual haplotypes representing intra-specific diversity within little penguin DNA obtained after stringent and conservative sequence filtering and error mitigation were performed, then selected only in the samples containing high sequence abundance for this taxon. One of these matched the 12s rRNA gene fragments of two independent penguin samples (MF370525, MK761006) from whole genomes from the same region (Sarker et al., 2017; Vianna et al., 2020). However, these were the only two whole genomes for little penguins published for southeastern Australia at the time of analyses. The selection of haplotypes was conservative, and false positives are unlikely, however, we acknowledge that several true haplotypes exist in the data and were excluded. Given the successful identification of realistic haplotypes in this study, we recommend that future studies of this wildlife conflict and others, further develop methods to target intra-specific diversity for species of concern. Notably, we recommend larger-scale sampling across the broader geographic range of this predator, including multiple seasons and years as sampling depth is an extremely important factor in inter- and intra-biodiversity (Shirazi et al., 2021). We recommend pairing a greater sampling depth with more in-depth analyses of intra-specific diversity using both multi-locus assay metabarcoding protocols and post-clustering “denoising” pipelines to determine biological sequences at single nucleotide resolution from sequencing error noise (Nearing et al., 2018).
While both metabarcoding and morphological methods provided statistically similar results in overall detection rates, in applying these assays together or separately, it is not realistic to assume these methods should detect target taxa in the same samples or even at the same rates and further research to better understand and potentially convert information between these assay types is needed (Thomas et al., 2014). Here, a greater diversity of prey were detected using both assays than by either assay alone and both assays cumulatively provide a range of estimates of predation and a range of information with which to assess predation incidence (detection and frequency-based) and magnitude (impacted number or biomass of prey) more rigorously than either method would alone, a finding shared by over 40 similar comparative studies (Hardy, PhD Thesis, 2018). Different detection rates reported between these methods and on a sample-by-sample basis in this study are also common across a broad range of predator and prey taxa (Tollit et al., 2009; Zarzoso-Lacoste et al., 2013), with studies reporting as little as 10% of positive samples containing both the hard-parts and DNA of the same species. This is likely due to differential gastrointestinal passage times of prey soft tissues (< 48 h) compared to their hard tissues (up to 7 days in another otariid study; Tollit et al., 2009). Soft tissues likely contain greater concentrations of DNA particularly for mitochondrial DNA, than do hard parts (Mumma et al., 2016; Granquist et al., 2018); therefore, even when present in the same samples, genetic information from soft tissues would be preferentially amplified because DNA from chitinous tissues (i.e., hard-parts such as feather, fur, or bone) is of poorer quality and requires specific processes for extraction (McDonald and Griffith, 2011; Rothe and Nagy, 2016).
We therefore emphasize that genetic and morphological analyses represent complementary assays of predation. For many conservation practitioners and ecologists aiming to investigate population-level predation across a range of wildlife interaction scenarios, treating these assays as semi-independent sampling methods that provide complementary information on predation will be fit-for-purpose. However, in monitoring interactions and consumption between rare species, and species of high conservation concern, additional assays and experimental design procedures would enable direct sample-by-sample comparison of consumed taxa, such as greater sub-sample replication and potential sample-based replicate pooling, as well as amplification and sequencing of all samples beyond those containing a positive in initial screening PCR. In our case, this was not financially feasible and we posit for this study system that additional funding could be spent on other value-add assays such as: (i) including screening for predator genetic diversity to identify individuals in a population contributing to predation of a sensitive or valuable species (Wegge et al., 2012), (ii) developing species-specific probes using older and cheaper technology (Fox et al., 2012) including cross-validation of eDNA data with quantitative PCR (Murray et al., 2011), and/or (iii) development of penguin-specific DNA-to-tissue-based correction factors which could provide consumed biomass information (Thomas et al., 2014).
Conclusions
We leveraged the growing utility of DNA metabarcoding alongside traditional diet analysis methods to investigate a wildlife conflict in southeastern Australia and with the goal to better inform decision making and long-term monitoring of this conflict. Our multi-assay results provide updated information on predation incidence by long-nosed fur seals on culturally valued little penguins in southeastern Australia at a critical time in the conservation management of both species. The genetic assay provided more nuanced estimates of possible predation rates, including additional semi-quantitative information useful for conservation practitioners in understanding the potential range in predation incidence. The genetic assay enabled exploration of genetic diversity within samples and usable estimates of the number of penguins consumed within the cross-section of sampled locations and times. This study demonstrates a need for research and development of techniques at the nexus of population genetics and environmental sampling. Additionally, predator impacts need to be considered and managed within up-to-date cumulative impact assessments for threats. We have delivered an important step towards this for little penguins in south-eastern Australia.
Data availability statement
The raw sequenced data files are publicly available at this location to be cited as: Hardy, Natasha et al. (2024). Sequencing data for seabird eDNA in long-nosed fur seal diets from southeastern Australia [Dataset]. Dryad. https://doi.org/10.5061/dryad.stqjq2cb3. Processed data, code and figures drafted for this publication are publicly available on Github: https://github.com/NatashaAHardy/pinp_stats.
Ethics statement
The animal study was approved by University of Sydney ethics permit (L04/9-2013/4/6056); Phillip Island Nature Parks Ethics Permit (2.2016). The study was conducted in accordance with the local legislation and institutional requirements.
Author contributions
NH: Conceptualization, Data curation, Formal analysis, Funding acquisition, Investigation, Methodology, Project administration, Resources, Software, Validation, Visualization, Writing – original draft, Writing – review & editing. TB: Conceptualization, Investigation, Methodology, Validation, Writing – original draft, Writing – review & editing. MB: Conceptualization, Investigation, Methodology, Resources, Supervision, Visualization, Writing – review & editing. NB: Methodology, Resources, Software, Supervision, Writing – review & editing. WF: Funding acquisition, Project administration, Resources, Supervision, Writing – review & editing. RM: Conceptualization, Funding acquisition, Investigation, Project administration, Resources, Supervision, Writing – original draft, Writing – review & editing.
Funding
The author(s) declare financial support was received for the research, authorship, and/or publication of this article. This project was funded by Phillip Island Nature Parks and the Australian Research Council Linkage Grant to Will Figueira (LP120100228) for support in NSW sample collections and processing.
Acknowledgments
We are grateful to the assistance of Cecilia Power and Lisa Lee Nen That in the Bott Laboratory at RMIT Bundoora. We thank Dáithí Murray for the provision and use of his bioinformatics pipeline. We are grateful to all field volunteers for sample collections, especially Tony Mitchell (Department of Energy, Environment and Climate Action), and Francois and Clover (Underwater Safaris Narooma) for their dedication ensuring sample collections. Samples from NSW were collected for another project and sub-samples were submitted to Phillip Island Nature Parks for screening of bird DNA. Samples from NSW were collected under University of Sydney ethics permit (L04/9-2013/4/6056); Australian Government permits to conduct research under the EPBC Act (AU-COM2013-224), and from the Office of Environment and Heritage NSW Scientific License (SL101244). Victorian research was performed under Phillip Island Nature Parks Ethics Permit (2.2016) and Department of Environment, Land, Water and Planning Research Permit (10007974). Harley Schinagl at Phillip Island Nature Parks produced Figure 1. We thank Karling Roberts, Taylor McLeod, Jerry Moxley and peer-reviewers for vastly improving this manuscript. We acknowledge the following Nations and Traditional Owners on whose unceded lands we conducted this research: Yuin (Barunguba), Bunurong (Millowl, Phillip Island), Gunditjmara (Cape Bridgewater and Deen Maar Island), Eastern Maar (Deen Maar Island), Kulin (RMIT Bundoora) and Eora (USYD).
Conflict of interest
NH is employed by SMRU Consulting.
The remaining authors declare that the research was conducted in the absence of any commercial or financial relationships that could be construed as a potential conflict of interest.
Publisher’s note
All claims expressed in this article are solely those of the authors and do not necessarily represent those of their affiliated organizations, or those of the publisher, the editors and the reviewers. Any product that may be evaluated in this article, or claim that may be made by its manufacturer, is not guaranteed or endorsed by the publisher.
Supplementary material
The Supplementary Material for this article can be found online at: https://www.frontiersin.org/articles/10.3389/fmars.2024.1288769/full#supplementary-material
References
ALA. (2019). Atlas of Living Australia (Canberra: Global Biodiversity Information Facility). Available online at: www.ala.org.au (Accessed January 2019).
Banks J. C., Mitchell A. D., Waas J. R., Paterson A. M. (2002). An unexpected pattern of molecular divergence within the blue penguin (Eudyptula minor) complex. Notornis 49, 29–38.
Benson D. A., Karsch-Mizrachi I., Lipman D. J., Ostell J., Wheeler D. L. (2005). GenBank. Nucleic Acids Res. 33, D34–D38. doi: 10.1093/nar/gki063
Berry T. E., Osterrieder S. K., Murray D. C., Coghlan M. L., Richardson A. J., Grealy A. K., et al. (2017). DNA metabarcoding for diet analysis and biodiversity: A case study using the endangered Australian sea lion (Neophoca cinerea). Ecol. Evol. 7, 5435–5453. doi: 10.1002/ece3.3123
BirdLife International (2021) Species factsheet: Eudyptula minor (Cambridge: BirdLife International). Available online at: www.birdlife.org (Accessed January 2021).
Bowen W. D., Iverson S. J. (2013). Methods of estimating marine mammal diets: A review of validation experiments and sources of bias and uncertainty. Mar. Mammal. Sci. 29, 719–754. doi: 10.1111/j.1748-7692.2012.00604.x
Cammen K. M., Rasher D. B., Steneck R. S. (2019). Predator recovery, shifting baselines, and the adaptive management challenges they create. Ecosphere 10, e02579. doi: 10.1002/ecs2.2579
Canale G. R., Bernardo C. S. S. (2016). Predator-prey interaction between two threatened species in a Brazilian hotspot. Biota Neotropica 16, e0059. doi: 10.1590/1676-0611-BN-2015-0059
Carroll E. L., Gallego R., Sewell M. A., Zeldis J., Ranjard L., Ross H. A., et al. (2019). Multi-locus DNA metabarcoding of zooplankton communities and scat reveal trophic interactions of a generalist predator. Sci. Rep. 9, 1–14. doi: 10.1038/s41598-018-36478-x
Casper R. M., Jarman S. N., Gales N. J., Hindell M. A. (2007). Combining DNA and morphological analyses of fecal samples improves insight into trophic interactions: a case study using a generalist predator. Mar. Biol. 152, 815–825. doi: 10.1007/s00227-007-0732-y
Cooper A. (1994). “DNA from Museum Specimens,” in Ancient DNA: Recovery and Analysis of Genetic Material from Paleontological, Archaeological, Museum, Medical, and Forensic Specimens. Eds. Herrmann B., Hummel S. (New York, NY, USA: Springer), 149–165. doi: 10.1007/978-1-4612-4318-2_10
Cummings C. R., Lea M. A., Lyle J. M. (2019). Fur seals and fisheries in Tasmania: An integrated case study of human-wildlife conflict and coexistence. Biol. Conserv. 236, 532–542. doi: 10.1016/j.biocon.2019.01.029
Dann P. (1991). Distribution, population trends and factors influencing the population size of little penguins eudyptula minor on Phillip Island, Victoria. Emu 91, 263–272. doi: 10.1071/MU9910263
Deagle B. E., Kirkwood R., Jarman S. N. (2009). Analysis of Australian fur seal diet by pyrosequencing prey DNA in feces. Mol. Ecol. 18, 2022–2038. doi: 10.1111/j.1365-294X.2009.04158.x
Deagle B. E., Thomas A. C., McInnes J. C., Clarke L. J., Vesterinen E. J., Clare E. L., et al. (2019). Counting with DNA in metabarcoding studies: How should we convert sequence reads to dietary data? Mol. Ecol. 28, 391–406. doi: 10.1111/mec.14734
Deagle B. E., Thomas A. C., Shaffer A. K., Trites A. W., Jarman S. N. (2013). Quantifying sequence proportions in a DNA-based diet study using Ion Torrent amplicon sequencing: which counts count? Mol. Ecol. Resour. 13, 620–633. doi: 10.1111/1755-0998.12103
Deagle B. E., Tollit D. J., Jarman S. N., Hindell M. A., Trites A. W., Gales N. J. (2005). Molecular scatology as a tool to study diet: analysis of prey DNA in scats from captive Steller sea lions. Mol. Ecol. 14, 1831–1842. doi: 10.1111/j.1365-294X.2005.02531.x
Edgar R. C. (2010). Search and clustering orders of magnitude faster than BLAST. Bioinformatics 26, 19, 2460–2461. doi: 10.1093/bioinformatics/btq461
Edgar R. C., Flyvbjerg H. (2015). Error filtering, pair assembly and error correction for next-generation sequencing reads. Bioinformatics 31, 3476–3482. doi: 10.1093/bioinformatics/btv401
Estes J. A., Tinker M. T., Williams T. M., Doak D. F. (1998). Killer whale predation on sea otters linking oceanic and nearshore ecosystems. Science 282, 473–476. doi: 10.1126/science.282.5388.473
Fox E. J., Reid-Bayliss K. S., Emond M. J., Loeb L. A. (2014). Accuracy of next generation sequencing platforms. Next Gener. Sequencing Appl. 1, 205–218. doi: 10.4172/2469-9853
Fox C. J., Taylor M. I., van der Kooij J., Taylor N., Milligan S. P., Albaina A., et al. (2012). Identification of marine fish egg predators using molecular probes. Mar. Ecol. Prog. Ser. 462, 205–218. doi: 10.3354/meps09748
Goldsworthy S. D., Bailleul F., Nursey-Bray M., Mackay A., Oxley A., Reinhold S.-L., et al. (2019). Assessment of the impacts of seal populations on the seafood industry in South Australia (Adelaide, SA, Australia: South Australian Research and Development Institute Aquatic Sciences), 334.
Goldsworthy S. D., Page B. (2007). A risk-assessment approach to evaluating the significance of seal bycatch in two Australian fisheries. Biol. Conserv. 139, 269–285. doi: 10.1016/j.biocon.2007.07.010
Goldsworthy S. D., Page B., Rogers P. J., Bulman C., Wiebkin A., McLeay L. J., et al. (2013). Trophodynamics of the eastern Great Australian Bight ecosystem: Ecological change associated with the growth of Australia’s largest fishery. Ecol. Model. 255, 38–57. doi: 10.1016/j.ecolmodel.2013.01.006
Granquist S. M., Esparza-Salas R., Hauksson E., Karlsson O., Angerbjörn A. (2018). Fish consumption of harbour seals (Phoca vitulina) in northwestern Iceland assessed by DNA metabarcoding and morphological analysis. Polar Biol. 41, 2199–2210. doi: 10.1007/s00300-018-2354-x
Hardy N. A. (2018). Investigating trophic effects of recolonizing generalist predators in complex ecosystems (Doctoral dissertation) (NSW, Australia: University of Sydney).
Hardy N. A., Berry T., Kelaher B. P., Goldsworthy S. D., Bunce M., Coleman M. A., et al. (2017). Assessing the trophic ecology of top predators across a recolonization frontier using DNA metabarcoding of diets. Mar. Ecol. Prog. Ser. 573, 237–254. doi: 10.3354/meps12165
Hervieux D., Hebblewhite M., Stepnisky D., Bacon M., Boutin S. (2014). Managing wolves (Canis lupus) to recover threatened woodland caribou (Rangifer tarandus caribou) in Alberta. Can. J. Zool. 92, 1029–1037. doi: 10.1139/cjz-2014-0142
Hocking D. P., Fitzgerald E. M., Salverson M., Evans A. R. (2016). Prey capture and processing behaviors vary with prey size and shape in Australian and subantarctic fur seals. Marine Mammal Science 32 (2), 568–587. doi: 10.1139/cjz-2014-0142
IUCN. (2020) The IUCN Red List of Threatened Species (Cambridge). Available online at: www.iucnredlist.org (Accessed July 2020).
Introduced by Bill Heffernan, Ian Campbell. (1975). Environment Protection and Biodiversity Conservation Act (Canberra, Australia: Office of Legislative Drafting and Publishing, Attorney-General’s Department).
Introduced by Bill Heffernan, Ian Campbell. (1999). Environment Protection and Biodiversity Conservation Act (Canberra, Australia: Office of Legislative Drafting and Publishing, Attorney-General’s Department).
Jeanniard-du-Dot T., Thomas A. C., Cherel Y., Trites A. W., Guinet C. (2017). Combining hard-part and DNA analyses of scats with biologging and stable isotopes can reveal different diet compositions and feeding strategies within a fur seal population. Mar. Ecol. Prog. Ser. 584, 1–16. doi: 10.3354/meps12381
Kearse M., Moir R., Wilson A., Stones-Havas S., Cheung M., Sturrock S., et al. (2012). Geneious Basic: An integrated and extendable desktop software platform for the organization and analysis of sequence data. Bioinformatics 28, 1647–1649. doi: 10.1093/bioinformatics/bts199
Kirkwood R., Sutherland D. R., Murphy S., Dann P. (2014). Lessons from long-term predator control: A case study with the red fox. Wildl. Res. 41, 222–232. doi: 10.1071/WR13196
Kliska K., McIntosh R. R., Jonsen I., Hume F., Dann P., Kirkwood R., et al. (2022). Environmental correlates of temporal variation in the prey species of Australian fur seals inferred from scat analysis. R. Soc. Open Sci. 9, 211723. doi: 10.1098/rsos.211723
Lalas C., Ratz H., McEwan K., McConkey S. D. (2007). Predation by New Zealand sea lions (Phocarctos hookeri) as a threat to the viability of yellow-eyed penguins (Megadyptes antipodes) at Otago Peninsula, New Zealand. Biol. Conserv. 135, 235–246. doi: 10.1016/j.biocon.2006.10.024
Leigh J. W., Bryant D. (2015). PopArt: Full-feature software for haplotype network construction. Methods Ecol. Evol. 6, 1110–1116. doi: 10.1111/2041-210X.12410
Ling J. (2014). Exploitation of fur seals and sea lions from Australian, New Zealand and adjacent subantarctic islands during the eighteenth, nineteenth and twentieth centuries. Aust. Zool. 31, 323–350. doi: 10.7882/AZ.1999.036
Marker P. F. (2016). Spatial scale and nest distribution of little penguins (Eudyptula minor) (Tasmania, Australia: University of Tasmania).
Marshall K. N., Stier A. C., Samhouri J. F., Kelly R. P., Ward E. J. (2016). Conservation challenges of predator recovery. Conserv. Lett. 9, 70–78. doi: 10.1111/conl.12186
Mata V. A., Rebelo H., Amorim F., McCracken G. F., Jarman S., Beja P. (2019). How much is enough? Effects of technical and biological replication on metabarcoding dietary analysis. Mol. Ecol. 28, 165–175. doi: 10.1111/mec.14779
McDonald P. G., Griffith S. C. (2011). To pluck or not to pluck: the hidden ethical and scientific costs of relying on feathers as a primary source of DNA. J. Avian Biol. 42, 197–203. doi: 10.1111/jav.2011.42.issue-3
McIntosh R. R., Page B., Goldsworthy S. D. (2006). Dietary analyis of regurgitates and stomach samples from free-living Australian sea lions. Wild. Res. 33, 661–669. doi: 10.1071/WR06025
McKenzie J., Page B., Shaughnessy P. D., Hindell M. A. (2007). Age and reproductive maturity of New Zealand fur seals (Arctocephalus forsteri) in southern Australia. J. Mammal. 88, 639–648. doi: 10.1644/06-MAMM-A-150R1.1
Mumma M. A., Adams J. R., Zieminski C., Fuller T. K., Mahoney S. P., Waits L. P. (2016). A comparison of morphological and molecular diet analyses of predator scats. J. Mammal. 97, 112–120. doi: 10.1093/jmammal/gyv160
Murray D. C., Bunce M., Cannell B. L., Oliver R., Houston J., White N. E., et al. (2011). DNA-based fecal dietary analysis: a comparison of qPCR and high throughput sequencing approaches. PloS One 6, e25776. doi: 10.1371/journal.pone.0025776
Nearing J. T., Douglas G. M., Comeau A. M., Langille M. G. (2018). Denoising the Denoisers: an independent evaluation of microbiome sequence error-correction approaches. PeerJ 6, e5364. doi: 10.7717/peerj.5364
Page B., McKenzie J., Goldsworthy S. D. (2005). Dietary resource partitioning among sympatric New Zealand and Australian fur seals. Mar. Ecol. Prog. Ser. 293, 283–302. doi: 10.3354/meps293283
Patel S., Waugh J., Millar C. D., Lambert D. M. (2010). Conserved primers for DNA barcoding historical and modern samples from New Zealand and Antarctic birds. Molecular Ecology Resources 10 (3), 431–438.
Pompanon F., Deagle B. E., Symondson W. O. C., Brown D. S., Jarman S. N., Taberlet P. (2012). Who is eating what: Diet assessment using next generation sequencing. Mol. Ecol. 21, 1931–1950. doi: 10.1111/j.1365-294X.2011.05403.x
R Core Team (2020). R: A language and environment for statistical computing, version 4.0.3 (Vienna, Austria: R Foundation for Statistical Computing).
Reinhold S. L., Goldsworthy S. D., Arnould J. P., Gillanders B. M., Connell S. D., McIntosh R. R. (2022). Tracing seal predation back to the source colony of their penguin prey: A trace element and stable isotope analysis. Front. Mar. Sci. 9, 813106. doi: 10.3389/fmars.2022.813106
Roman J., Dunphy-Daly M. M., Johnston D. W., Read A. J. (2015). Lifting baselines to address the consequences of conservation success. Trends Ecol. Evol. 30, 299–302. doi: 10.1016/j.tree.2015.04.003
Ropert-Coudert Y., Chiaradia A., Ainley D., Barbosa A., Boersma P. D., Brasso R., et al. (2019). Happy feet in a hostile world? The future of penguins depends on proactive management of current and expected threats. Front. Mar. Sci. 6. doi: 10.3389/fmars.2019.00248
Rothe J., Nagy M. (2016). Comparison of two silica-based extraction methods for DNA isolation from bones. Legal Med. 22, 36–41. doi: 10.1016/j.legalmed.2016.07.008
Sarker S., Das S., Frith S., Forwood J. K., Helbig K., Raidal S. R. (2017). Complete mitochondrial genome sequence of an Australian little penguin (Eudyptula minor novaehollandia, JR Forster 1781). Mitochon. DNA Part B 2, 428–429. doi: 10.1080/23802359.2017.1357446
Schnell I. A., Bohmahh K., Gilbert T. P. (2015). Tag jumps illuminaated – reducing sequence-to-sample misidentifications in metabarcoding studies. Mol. Ecol. Res. 15, 1289–1303. doi: 10.1111/1755-0998.12402
Seersholm F. V., Cole T. L., Grealy A., Rawlence N. J., Greig K., Knapp M., et al. (2018). Subsistence practices, past biodiversity, and anthropogenic impacts revealed by New Zealand-wide ancient DNA survey. Proc. Natl. Acad. Sci. 115, 7771–7776. doi: 10.1073/pnas.1803573115
Shaughnessy P. D., Goldsworthy S. D., Mackay A. I. (2015). The long-nosed fur seal (Arctocephalus forsteri) in South Australia in 2013–14: Abundance, status and trends. Aust. J. Zool. 63, 101–110. doi: 10.1071/ZO14103
Shaughnessy P. D., Kirkwood R., Cawthorn M., Kemper C., Pemberton D. (2003). “Pinnipeds, cetaceans and fisheries in Australia; a review of operational interactions,” in Marine mammals: Fisheries, tourism and management issues. Eds. Gales N., Hindell M., Kirkwood R. (Melbourne, VIC, Australia: CSIRO Publishing), 136–152.
Shirazi S., Meyer R. S., Shapiro B. (2021). Revisiting the effect of PCR replication and sequencing depth on biodiversity metrics in environmental DNA metabarcoding. Ecol. Evol. 11, 15766–15779. doi: 10.1002/ece3.8239
Sigsgaard E. E., Nielsen I. B., Bach S. S., Lorenzen E. D., Robinson D. P., Knudsen S. W., et al. (2016). Population characteristics of a large whale shark aggregation inferred from seawater environmental DNA. Nat. Ecol. Evol. 1, 1–5. doi: 10.1038/s41559-016-0004
Stat M., John J., DiBattista J. D., Newman S. J., Bunce M., Harvey E. S. (2019). Combined use of eDNA metabarcoding and video surveillance for the assessment of fish biodiversity. Conserv. Biol. 33, 196–205. doi: 10.1111/cobi.13183
Sutherland D. R., SChinagl H., Dann P. (2022). “Catastrophic decline in a super colony of little penguins,” in Island Ark Symposium VII, Partnering for Land, Sea and Coast, Phillip Island Nature Parks, Penguin Parade Visitor Centre, Victoria, 5-9 September 2022. 28.
Taberlet P., Brown A., Zinger L., Coissac E. (2018). Environmental DNA for Biodiversity Research and Monitoring (Oxford, United Kingdom: Oxford University Press). doi: 10.1093/oso/9780198767220.001.0001
Thomas A. C., Deagle B. E., Eveson J. P., Harsch C. H., Trites A. W. (2016). Quantitative DNA metabarcoding: improved estimates of species proportional biomass using correction factors derived from control material. Mol. Ecol. Resour. 16, 714–726. doi: 10.1111/1755-0998.12490
Thomas A. C., Jarman S. N., Haman K. H., Trites A. W., Deagle B. E. (2014). Improving accuracy of DNA diet estimates using food tissue control materials and an evaluation of proxies for digestion bias. Mol. Ecol. 23, 3706–3718. doi: 10.1111/mec.12523
Tisdell C. A., Wilson C. (2012). “Little penguins and other seabirds as tourist draw cards,” in Nature-based Tourism and Conservation: New Economic Insights and Case Studies (Cheltenham, U.K and Northampton, Massachusetts, U.S.A: Edward Elgar Publishing), 355–380.
Tollit D. J., Schulze A. D., Trites A. W., Olesiuk P. F., Crockford S. J., Gelatt T. S., et al. (2009). Development and application of DNA techniques for validating and improving pinniped diet estimates. Ecol. Appl. 19, 889–905. doi: 10.1890/07-1701.1
Tsuji S., Maruyama A., Miya M., Ushio M., Sato H., Minamoto T., et al. (2020). Environmental DNA analysis shows high potential as a tool for estimating intraspecific genetic diversity in a wild fish population. Mol. Ecol. Resour. 20, 1248–1258. doi: 10.1111/1755-0998.13165
Tworkowski L., Ellenberg U., Dann P., Richardson E., Robert K. (2018). “Anthropogenic climate change: are little penguins feeling the heat?,” in [Conference presentation] 5th Oceania Congress for Conservation Biology (OCCB), Wellington, New Zealand.
Van den Bulcke L., De Backer A., Ampe B., Maes S., Wittoeck J., Waegeman W., et al. (2021). Towards harmonization of DNA metabarcoding for monitoring marine macrobenthos: the effect of technical replicates and pooled DNA extractions on species detection. Metabarcod. Metagen. 5, e71107. doi: 10.3897/mbmg.5.71107
Veríssimo D., Jones D. A., Chaverri R., Meyer S. R. (2012). Jaguar Panthera onca predation of marine turtles: conflict between flagship species in Tortuguero, Costa Rica. Oryx 46, 340–347. doi: 10.1017/S0030605311001487
Vianna J. A., Fernandes F. A. N., Frugone M. J., Figueiro H. V., Pertierra L. R., Noll D., et al. (2020). Genome-wide analyses reveal drivers of penguin diversification. Proc. Natl. Acad. Sci. 117, 22303–22310. doi: 10.1073/pnas.2006659117
Visser I. N., Drennan M. P., White R. W., MacLean S. F., Lagerstrom L. C., Francis J. M. (2008). Antarctic Fur Seals (Arctocephalus gazella) Observed Predating Adélie (Pygoscelis adeliae) and Chinstrap Penguins (P. Antarctica), Antarctic Peninsula. Aquat. Mammals 34, 193–199. doi: 10.1578/AM.34.2.2008.193
Wegge P., Shrestha R., Flagstad Ø. (2012). Snow leopard Panthera uncia predation on livestock and wild prey in a mountain valley in northern Nepal: Implications for conservation management. Wildl. Biol. 18, 131–141. doi: 10.2981/11-049
Welman S., Pichegru L. (2023). Nest microclimate and heat stress in African Penguins Spheniscus demersus breeding on Bird Island, South Africa. Bird Conserv. Int. 33, e34. doi: 10.1017/S0959270922000351
Williams T. D. (1995). The penguins: Spheniscidae. Eds. Wilson R. P., Boersma P.D., Stokes D. L. (Oxford: Oxford University Press), ISBN: ISBN 0-19-854667-X. OCLC 30736089. Illustrated by: Jeff Davies & John Busby.
Williams R., Krkošek M., Ashe E., Branch T. A., Clark S., Hammond P. S., et al. (2011). Competing conservation objectives for predators and prey: estimating killer whale prey requirements for chinook salmon. PloS One 6, 11. doi: 10.1371/journal.pone.0026738
Keywords: ecological surveillance, conservation management and monitoring, predator-prey interaction, predation impact, eDNA, fur seal (Arctocephalus forsteri), little penguin (Eudyptula minor), diet analysis techniques
Citation: Hardy NA, Berry TE, Bunce M, Bott NJ, Figueira WF and McIntosh RR (2024) Quantifying wildlife conflicts with metabarcoding and traditional dietary analyses: applied to seabird predation by long-nosed fur seals. Front. Mar. Sci. 11:1288769. doi: 10.3389/fmars.2024.1288769
Received: 04 September 2023; Accepted: 25 April 2024;
Published: 15 May 2024.
Edited by:
Todd Atwood, Alaska, United StatesReviewed by:
Won Young Lee, Korea Polar Research Institute, Republic of KoreaDavid Stanković, National Institute of Biology, Slovenia
Copyright © 2024 Hardy, Berry, Bunce, Bott, Figueira and McIntosh. This is an open-access article distributed under the terms of the Creative Commons Attribution License (CC BY). The use, distribution or reproduction in other forums is permitted, provided the original author(s) and the copyright owner(s) are credited and that the original publication in this journal is cited, in accordance with accepted academic practice. No use, distribution or reproduction is permitted which does not comply with these terms.
*Correspondence: Natasha A. Hardy, nahardy.wildlife@gmail.com; Rebecca R. McIntosh, rmcintosh@penguins.org.au