Behavior analysis of juvenile steelhead trout under blue and red light color conditions based on multiple object tracking
 Ziyu Li
 Xueweijie Chen
 Jinze Huang
 Dong An
 Yangen Zhou
- 1National Innovation Center for Digital Fishery, China Agricultural University, Beijing, China
- 2Key Laboratory of Smart Farming Technologies for Aquatic Animals and Livestock, Ministry of Agriculture and Rural Affairs, China Agricultural University, Beijing, China
- 3Beijing Engineering and Technology Research Centre for Internet of Things in Agriculture, Beijing, China
- 4College of Information and Electrical Engineering, China Agricultural University, Beijing, China
- 5Key Laboratory of Mariculture (Ocean University of China), Ministry of Education, Qingdao, China
Introduction: The lighting environment significantly influences fish behavior. This study explores the impact of diverse lighting conditions on the behavior of steelhead trout (Oncorhynchus mykiss) to illuminate the mechanisms underlying their behavioral responses.
Methods: This experiment was set up with six treatments at a constant light intensity of 150 lx: 12h white light + 12h dark (12 W), 12h blue light + 12h dark (12B), 12h red light + 12h dark (12 R), 1.5h blue light + 9h red light + 1.5h blue light + 12h dark (3B9R), 3h blue light + 6h red light + 3h blue light + 12h dark (6B6R), total 12h of blue and red light + 12h dark (T12BR). A multiple object tracking method, YOLOv5 with SORT, was employed to capture the movement trajectory of each fish, quantifying three motion metrics: swimming velocity, swimming angular velocity, and generalized intersection over union.
Results: The results revealed that fish exposed to 12R light environment showed significantly higher activity levels than other groups. The mixed light environments (3B9R, 6B6R) formed significant differences in behavioral metrics with 12R earlier than pure light environments (12B, 12W, T12BR), indicating sudden light color changes should be avoided. Fish in the 3B9R environment exhibited the lowest activity level but highest growth performance, with the highest specific growth rate of 1.91±0.12 d-1, a value significantly surpassing the lowest recorded rate, supported by a p-value of 0.0054, indicating it is suitable for steelhead trout cultivation.
Discuss: Behavioral significant differences were observed as early as week eight, much earlier than physiological differences, which became apparent by week 16. Overall, this paper employs computer vision methods to study the impact of different light colors on fish behavior, found that 3B9R is the optimal lighting condition tested and sudden light color changes should be avoided, offering a new perspective on light conditions and behavior in steelhead trout cultivation.
1 Introduction
In aquaculture, the breeding environment factors, such as light, temperature, and dissolved oxygen, significantly influence fish growth. Light, which consists of light intensity, light color, and photoperiod, serves as a fundamental environmental factor playing a crucial role in the growth process of fish (Villamizar et al., 2011; Zhang et al., 2020). Fish have evolved light-sensing mechanisms throughout their evolution to adapt to environmental light conditions, thereby lighting conditions affect fish behavior (Xu et al., 2019; Noureldin et al., 2021). Existing research has found that light spectrum conditions can influence the growth, immune response, and digestive and metabolic capabilities of steelhead trout (Chen et al., 2022a, 2022b). Light affects fish metabolism, growth, and behavior through visual stimulation, and appropriate lighting conditions are beneficial for improving fish welfare and promoting growth (Ruchin, 2020). Fish behavior reflects their growth and physiological status, and analyzing behavior is conducive to identifying suitable light environments.
Light color (spectrum), as a fundamental factor of light condition (Zhang et al., 2020), has a significant impact on fish physiological traits due to their long-evolutionary adaptations, subsequently affecting fish growth and behavior. Some studies have found that specific light colors can enhance the growth of fish, for instance, yellow light for pearl gourami (Trichopodus leerii) (Heydarnejad et al., 2017), green light for barfin flounder (Verasper moseri) (Takahashi et al., 2016, 2018; Yamanome et al., 2009), red light for pikeperch (Sander lucioperca) (Baekelandt et al., 2019) and yellow perch (Perca flavescens) (Head and Malison, 2007), blue light for goldfish (Carassius auratus) (Noureldin et al., 2021) and turbot (Scophthalmus maximus) (Wu et al., 2021). Additionally, there are previous studies that focus on the influence of light color on fish behavior. For example, juvenile Nile tilapia showed a preference for yellow and red light (Luchiari and Oliveira, 2014). Young grass carp avoid red light and prefer blue (Mu et al., 2019). Juvenile bighead carp (Aristichthys nobilis) swim significantly slower under yellow and green light than under red and blue light (Xi et al., 2019). Goldfish (Carassius auratus) reared under blue light exhibited a lower ventilation frequency, longer reaction time, and longer swimming duration (Noureldin et al., 2021) in the novel object test, a behavioral assessment where fish are presented with an unfamiliar object to measure their exploratory and stress responses (Norton et al., 2011; Norton and Gutiérrez, 2019). Both behavior and growth are long-term outcomes of fish physiological traits. Analyzing fish behavior is conductive to identify suitable light environments for fish cultivation. However, previous studies mainly focused on the effects of single light color on fish growth and behavior, and there is limited information on the effects of light combination on fish behavior.
With the advancements in deep learning and computer vision in recent years, computer vision based methods are increasingly being employed in the study of fish behavior (Li et al., 2020; Yang et al., 2020; Li, D. et al., 2022). Fish multiple object tracking technology has demonstrated increasingly powerful capabilities, efficiently and accurately capturing fish trajectories (Li, W. et al., 2022; Mandel et al., 2023; Liu et al., 2024). Compared to manual and acoustic-based methods, computer vision-based fish multiple object tracking approaches offer lower costs and higher efficiency, enabling rapid processing of large volumes of videos to obtain fish behavior information for further study. Currently, fish multiple object tracking methods have been widely applied in fish behavior and aquaculture research. For instance, Wang et al. proposed an end-to-end detection and tracking method to identify abnormal behaviors in porphyry seabream (Wang et al., 2022b). Li et al. introduced a detection and tracking method to study the behavior of Oplegnathus punctatus in the ammonia nitrogen environment (Li et al., 2023). Additionally, Xiao et al. developed a tracking method based on attention regions to investigate fish behavior for water quality monitoring (Xiao et al., 2016).
The spectral distribution of light in water is greatly influenced by depth (Liu et al., 2016; Hou et al., 2019). Specially, blue light can penetrate up to 200 meters in clear water, while red light is mostly absorbed within the first 20 meters (Sanchez-Vazquez et al., 2019; Ruchin, 2020). Juvenile steelhead trout reside in shallow freshwater streams (Hartman, 1965; Bugert et al., 1991), and the average swimming depth for adult steelhead trout is around 1.6 meters (Ruggerone et al., 1990), where both blue and red light can be perceived by fish. In this study, considering the natural light environment of steelhead trout, a variety of experimental conditions were established with mixed light colors and varying durations, employing computer vision and artificial intelligence techniques to quantify fish behavior in their daily activities. The growth and immunity performance of steelhead trout under different light color combinations has been studied (Chen et al., 2022b) as well as their digestive and anabolic capabilities (Chen et al., 2022a) based on this experiment. The computer vision-based object detection method YOLOv5 (Jocher et al., 2022) and the multiple object tracking method SORT (Bewley et al., 2016) were introduced to capture fish trajectories. The potential relationship between quantified behavioral traits and physiological characteristics was discussed. Therefore, this study demonstrates the feasibility of using behavioral quantification methods to guide the regulation of fish growth environments. The proposed quantification process in this paper can provide guidance for precise environmental control.
2 Materials and methods
2.1 Animals
Triploid steelhead trout eyed eggs were purchased from Troutlodge, Inc. (Washington, USA) and hatched at the Wanzefeng Fishery Company (Rizhao, Shandong, China). Before starting the experiment, the juvenile trout were acclimatized to a brackish saltwater environment (salinity: 14.2 ± 0.7) for 2 weeks. In this stage, the fish were given twice-daily feedings to apparent satiation at 08:00 and 18:30 with a commercial trout feed from Greatseven Inc. (Qingdao, China). The controlled environment was maintained with a constant 24-hour oxygen supply and a 12 light(L):12 dark(D) photoperiod.
2.2 Trial design
Six light color treatments were established with a photoperiod of 12L:12D (light period: 07:30-19:30) and total light intensity of 150 lx: 12 h white light + 12 h dark (12 W, full spectrum); 12 h blue light + 12 h dark (12B, peak at 454.9 nm); 12 h red light + 12 h dark (12 R, peak at 614.8 nm); 1.5 h blue light + 9 h red light + 1.5 h blue light + 12 h dark (3B9R, peaks at 454.9 nm and 614.8 nm, respectively); 3 h blue light + 6 h red light + 3 h blue light + 12 h dark (6B6R, peaks at 454.9 nm and 614.8 nm, respectively); 12 h blue light and red light + 12 h dark (T12BR, peaks at 454.9 nm + 614.8 nm, respectively), as illustrated in Figure 1. The light intensity of each treatment ensured to be consistent by calculating the average from measurements taken at the surface, middle, and bottom layers of the water. This guaranteed that the spectral composition of light was the only varying factor between treatments. By eliminating the influence of fluctuating light intensities, the differential impacts of light spectra on fish behavior can be analysed more accurately. The light was provided by packaged LED (COB) designed and produced by Qingdao Lanchi Technology Company. High-precision electronic adjustment of light intensity is not supported. Instead, light intensity was ensured by adjusting the distance between the light source and the water surface. Light intensity and spectra were measured using a handheld illuminometer (PLA300; Everfine Inc., Hangzhou, China). The 16-week trial was conducted using a completely randomized block design with four replicates per treatment, 20 fish per tank (380 L volume, 0.72 m height × 0.95 m diameter, white background). Each tank was shielded by black light-absorbing fabric, ensuring no light interference occurred between the various treatment groups. Fish were weighed by an electronic balance (Mettler-Toledo International, Inc., Greifensee, Switzerland).
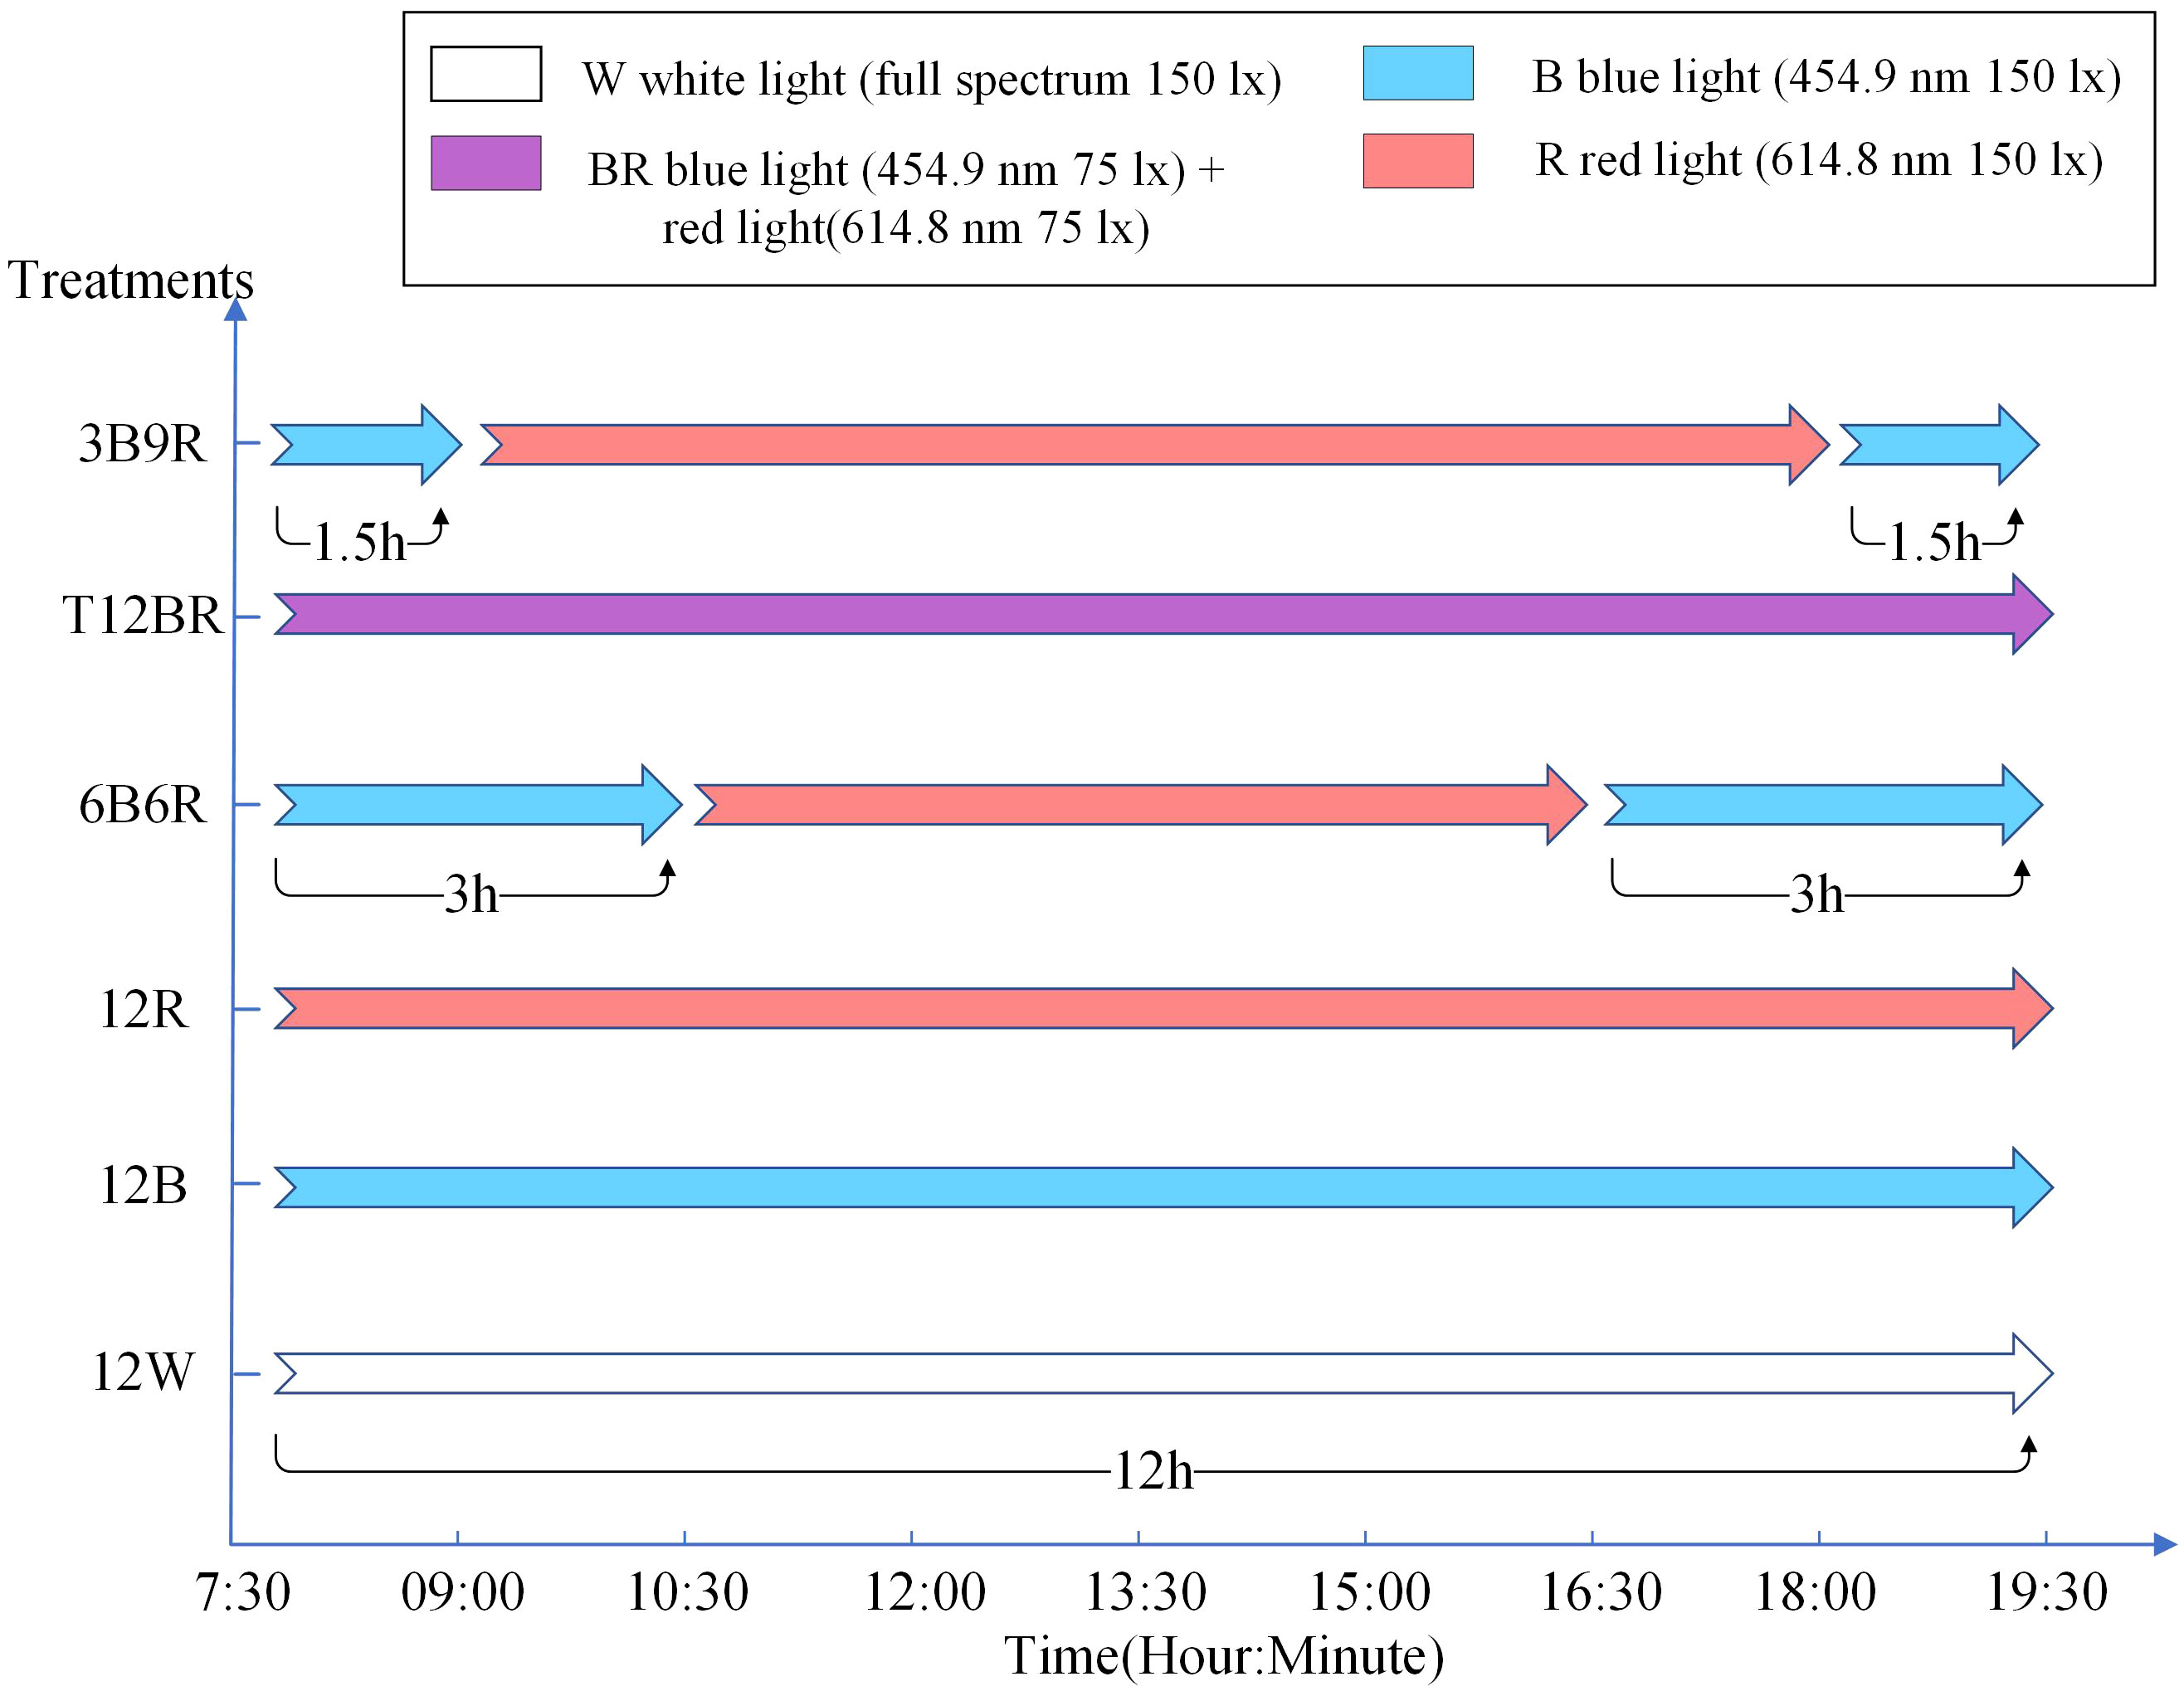
Figure 1 setting of light color groups in this experiment. In this experiment, the photoperiod was set to 12L12D, with 12 hours of light (from 7:30 to 19:30) and 12 hours of darkness every day. The naming convention for treatments is derived from the arrangement of light colors within the 12-hour light period, denoted as xCyD: C color light for X hours, D color light for y hours. For instance, ‘3B9R’ denotes blue light for 3 hours and 9 hours of red light, and ‘12B’ denotes blue light for 12 hours.
At the the start and conclusion of the trail, there was a 36-hour halt in feeding to guarantee the digestive tracts of fish were empty. Before beginning the experiment, the fish were submerged in a solution containing 30 mg/L of tricaine methanesulfonate (MS-222; Sigma-Aldrich, USA) for anesthesia. And they were delicately dried using tissue before being weighed. Throughout the cultivation period, each trout, with an initial weight of 34.67 ± 2.69 g, received commercial trout feed daily at 08:00 and 18:30 respectively. Residual unconsumed feed was collected after feeding for 30 min. The calculation of daily feed intake involved evaluating the moisture content of the feed and adjusting for any loss. The water was renewed via a single flow system with a flow rate of 1.15 L/min. Parameters such as water temperature, salinity, dissolved oxygen, and pH were measured three times daily using a YSI ProPlus handheld multiparameter meter (YSI Inc., USA). Sampling of the water occurred every three days, with subsequent analysis involving the Cleverchem 380 automatic chemical analyzer (DeChem-Tech Inc., Hamburg, Germany) to determine levels of total ammonia nitrogen (TAN), phosphate, nitrite nitrogen, and nitrate nitrogen.
Several measures were implemented in order to minimize noise interference in the experiment. Firstly, PVC damping trays (1.1m × 1.1m in width × 10 cm) were placed at the bottom of the rearing tanks. Secondly, the exterior of the rearing tanks and the black shielding fabric were covered with sound-absorbing cotton. Thirdly, nano-aeration discs and liquid oxygen were utilized for aeration. Fourthly, adherence to standardized experimental protocols was strictly maintained, minimizing disturbances during operations. Finally, the PVC pipes for water inflow and outflow were covered with shock-absorbing sound insulation materials.
During the experimental period, the following water quality parameters (mean ± standard deviation) were maintained: water temperature at 16.5 ± 0.2°C, salinity at 14.2 ± 0.7, dissolved oxygen at 8.7 ± 0.3 mg/L, pH value at 7.3 ± 0.1, ammonia nitrogen (TAN) at 0.03 ± 0.03 mg N/L, phosphate at 0.11 ± 0.08 mg P/L, nitrite nitrogen at 0.09 ± 0.05 mg/L, and nitrate nitrogen at 3.43 ± 1.9 mg N/L.
At 4-week intervals, the fish in each tank were anesthetized with 30 mg/L tricaine MS-222, counted, and weighed. The fish behavior was captured using 1080P infrared night vision video webcams (DS-IPC-T12) from Hikvision Digital Technology Co., Ltd. (Hangzhou, China) and saved as videos. The webcams, mounted on a bracket 1.5 m above each tank, recorded videos at a frame rate of 25 frames per second (FPS), capturing the fish swimming behavior from a top-down perspective. Videos were captured daily between 07:30 h and 19:30 h, stored on the hard disk, and each video lasted approximately one hour (resulting in 12 videos for 12 hours per day). The total experimental environment is shown in Figure 2. To prevent the influence of light color on the image-based method, the videos were captured in grayscale. Due to the substantial volume of video data and the limitations in processing and analysis speed, a balance was struck between the representativeness of the sample and analytical efficiency. Segments of the videos that included fish feeding moments (30 minutes each in the morning and evening), were removed to prevent any interference with the swimming behavior analysis. Furthermore, the initial ten minutes of each processed hourly video were selected as a representative segment for that hour, which was then utilized for the subsequent tracking of fish trajectories and behavior analysis. Although the trial lasted 16 weeks, the records from the first 8 weeks were utilized for behavior analysis, as significant behavioral differences became apparent by the eighth week, which was earlier than significant differences in growth.
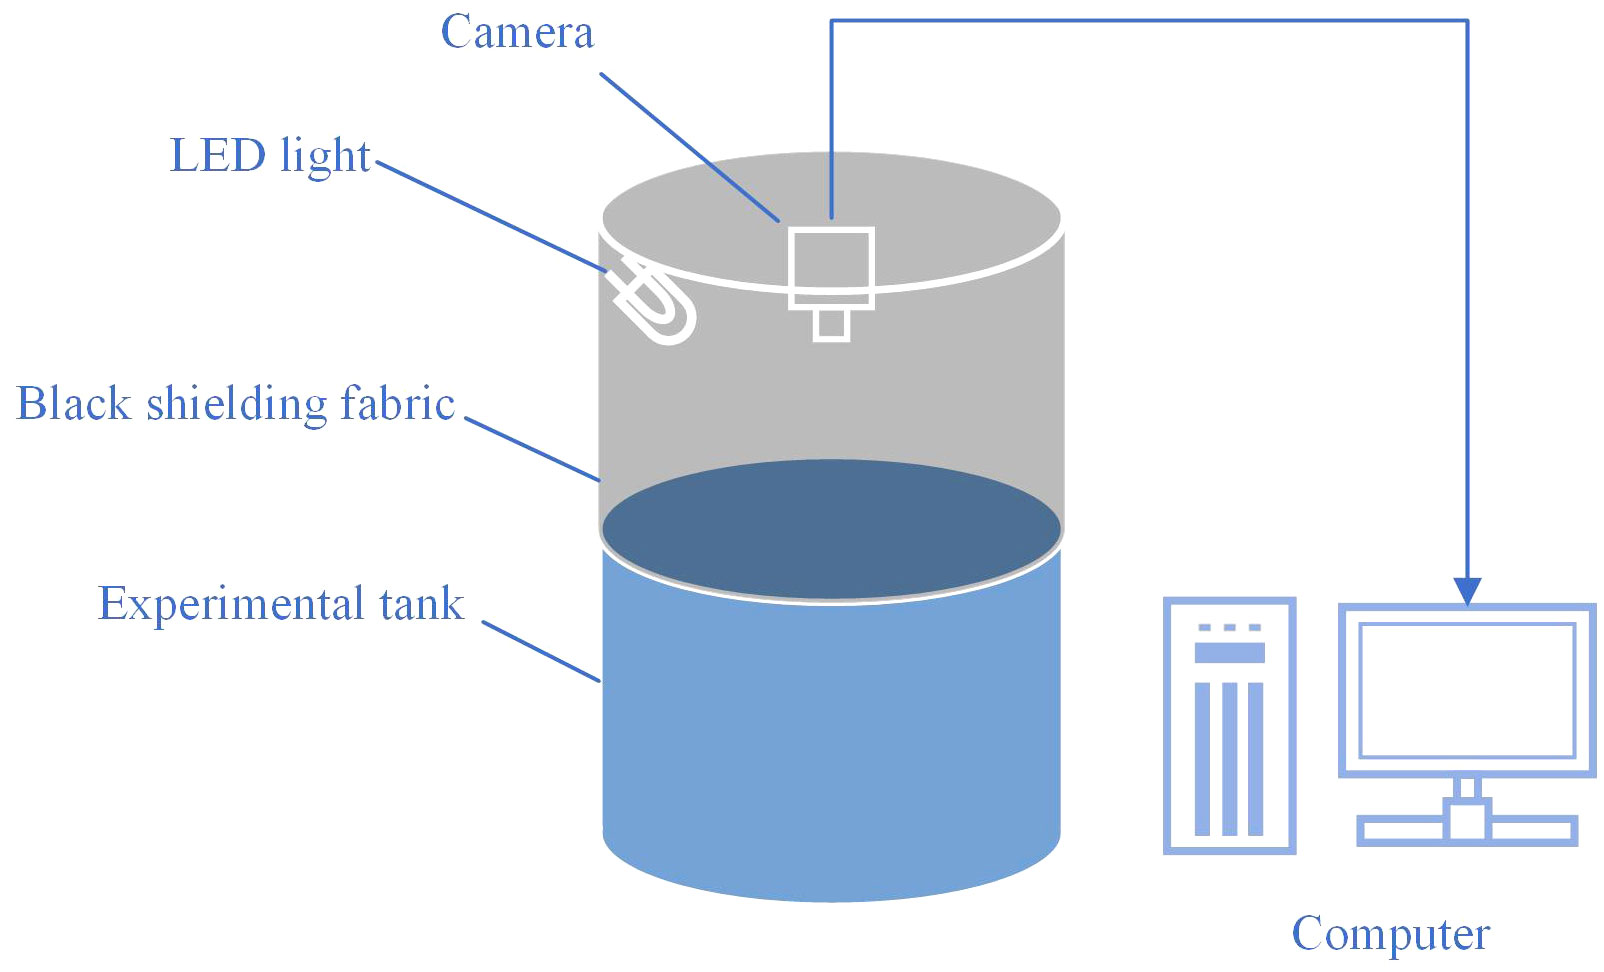
Figure 2 Experimental environment.
In this experiment, fish were reared in experimental tanks (380 L volume, 1.0 m height × 0.95 m diameter, with a white background), with 20 fish per tank. Tanks were covered with a back shielding fabric to prevent interference between different treatment groups. Illumination with various light colors was provided by LED sources (packaged LED (COB), Qingdao Lanchi Technology Company), and fish behavior was recorded from a top-down perspective using a camera (DS-IPC-T12, Hikvision Digital Technology Co., Ltd.), with videos stored on computer hard drives.
2.3 Fish behavior analysis
In this experiment, the YOLOv5 with Sort algorithm was employed to perform multiple object tracking on ten-minute video segments of six treatments, with twelve segments recorded each day to correspond with the 12L:12D photoperiod. This process generated frame-by-frame bounding boxes depicting the motion trajectories of individual fish. Subsequently, fish swimming behavior was quantified using three behavioral metrics: Swimming Velocity (SV), Swimming Angular Velocity (SAV), and Generalized Intersection over Union (GIOU). Finally, a statistical analysis was conducted to assess the impact of different light color environments on fish behavior.As for the possible social interactions (hierarchies) among fish, thisstudy primarily focused on investigating the collective behavior of the entire fish population, particularly by measuring average values of metricssuch as SV, SAV, and GIOU under different light conditions. This approach naturally integrates the possible social interactions among fish, as these averages reflect the collective behavioral performance of all individuals under specific light conditions. By concentrating on the behavioral dynamics at the population level, theanalysis implicitly including the influence of social structures on overall behavioral patterns without the need for direct quantification of specific social interactions among individual fish.
2.3.1 Multiple fish tracking
A subset of fish behavior videos was selected from the experiment to create a fish dataset through annotation. Training and performance comparisons of several popular Multiple Object Tracking (MOT) algorithms, including YOLOv5 with SORT and CenterTrack, were conducted using this dataset, as shown in Table 1 in section 3.1 of the Results. Metrics such as Mean Average Precision (mAP50), Multiple Object Tracking Accuracy (MOTA), and Identity F1 Score (IDF1) were employed for evaluation. YOLOv5 with SORT exhibited superior performance and was chosen in this trial. YOLOv5, an object detection algorithm that has been widely utilized in aquaculture studies (Li, X. et al., 2022; Wang et al., 2022a), can locate fish individuals in each frame with bounding boxes. SORT is an instance association algorithm that uses positional information to associate bounding boxes of the same fish individual across consecutive frames, resulting in fish motion trajectories, as shown in Figure 3. SORT was also widely employed for fish tracking (Wang et al., 2021; Gong et al., 2022; Zhang et al., 2023). In this experiment, YOLOv5 with SORT was employed for multiple object tracking of fish videos recorded, utilizing bounding boxes to represent fish motion trajectories, for subsequent behavioral quantification and analysis. Despite the inevitable presence of some false positives and false negatives, the comprehensive fish dataset, effective behavioral quantification metrics, and scientifically sound statistical methods employed ensure that the results accurately reflect the overall movement trajectories and behavioral states of the fish.
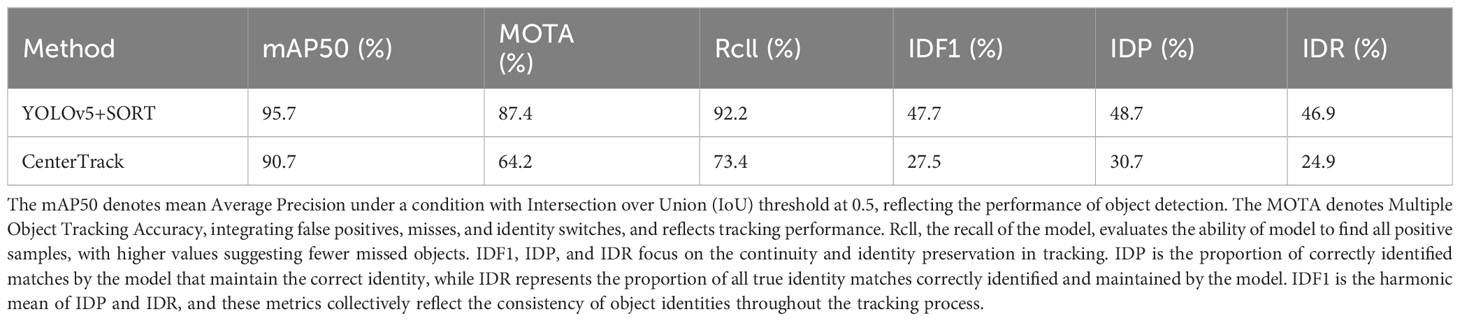
Table 1 Evaluation Metrics for the performance of MOT(Multi Object Tracking) methods.
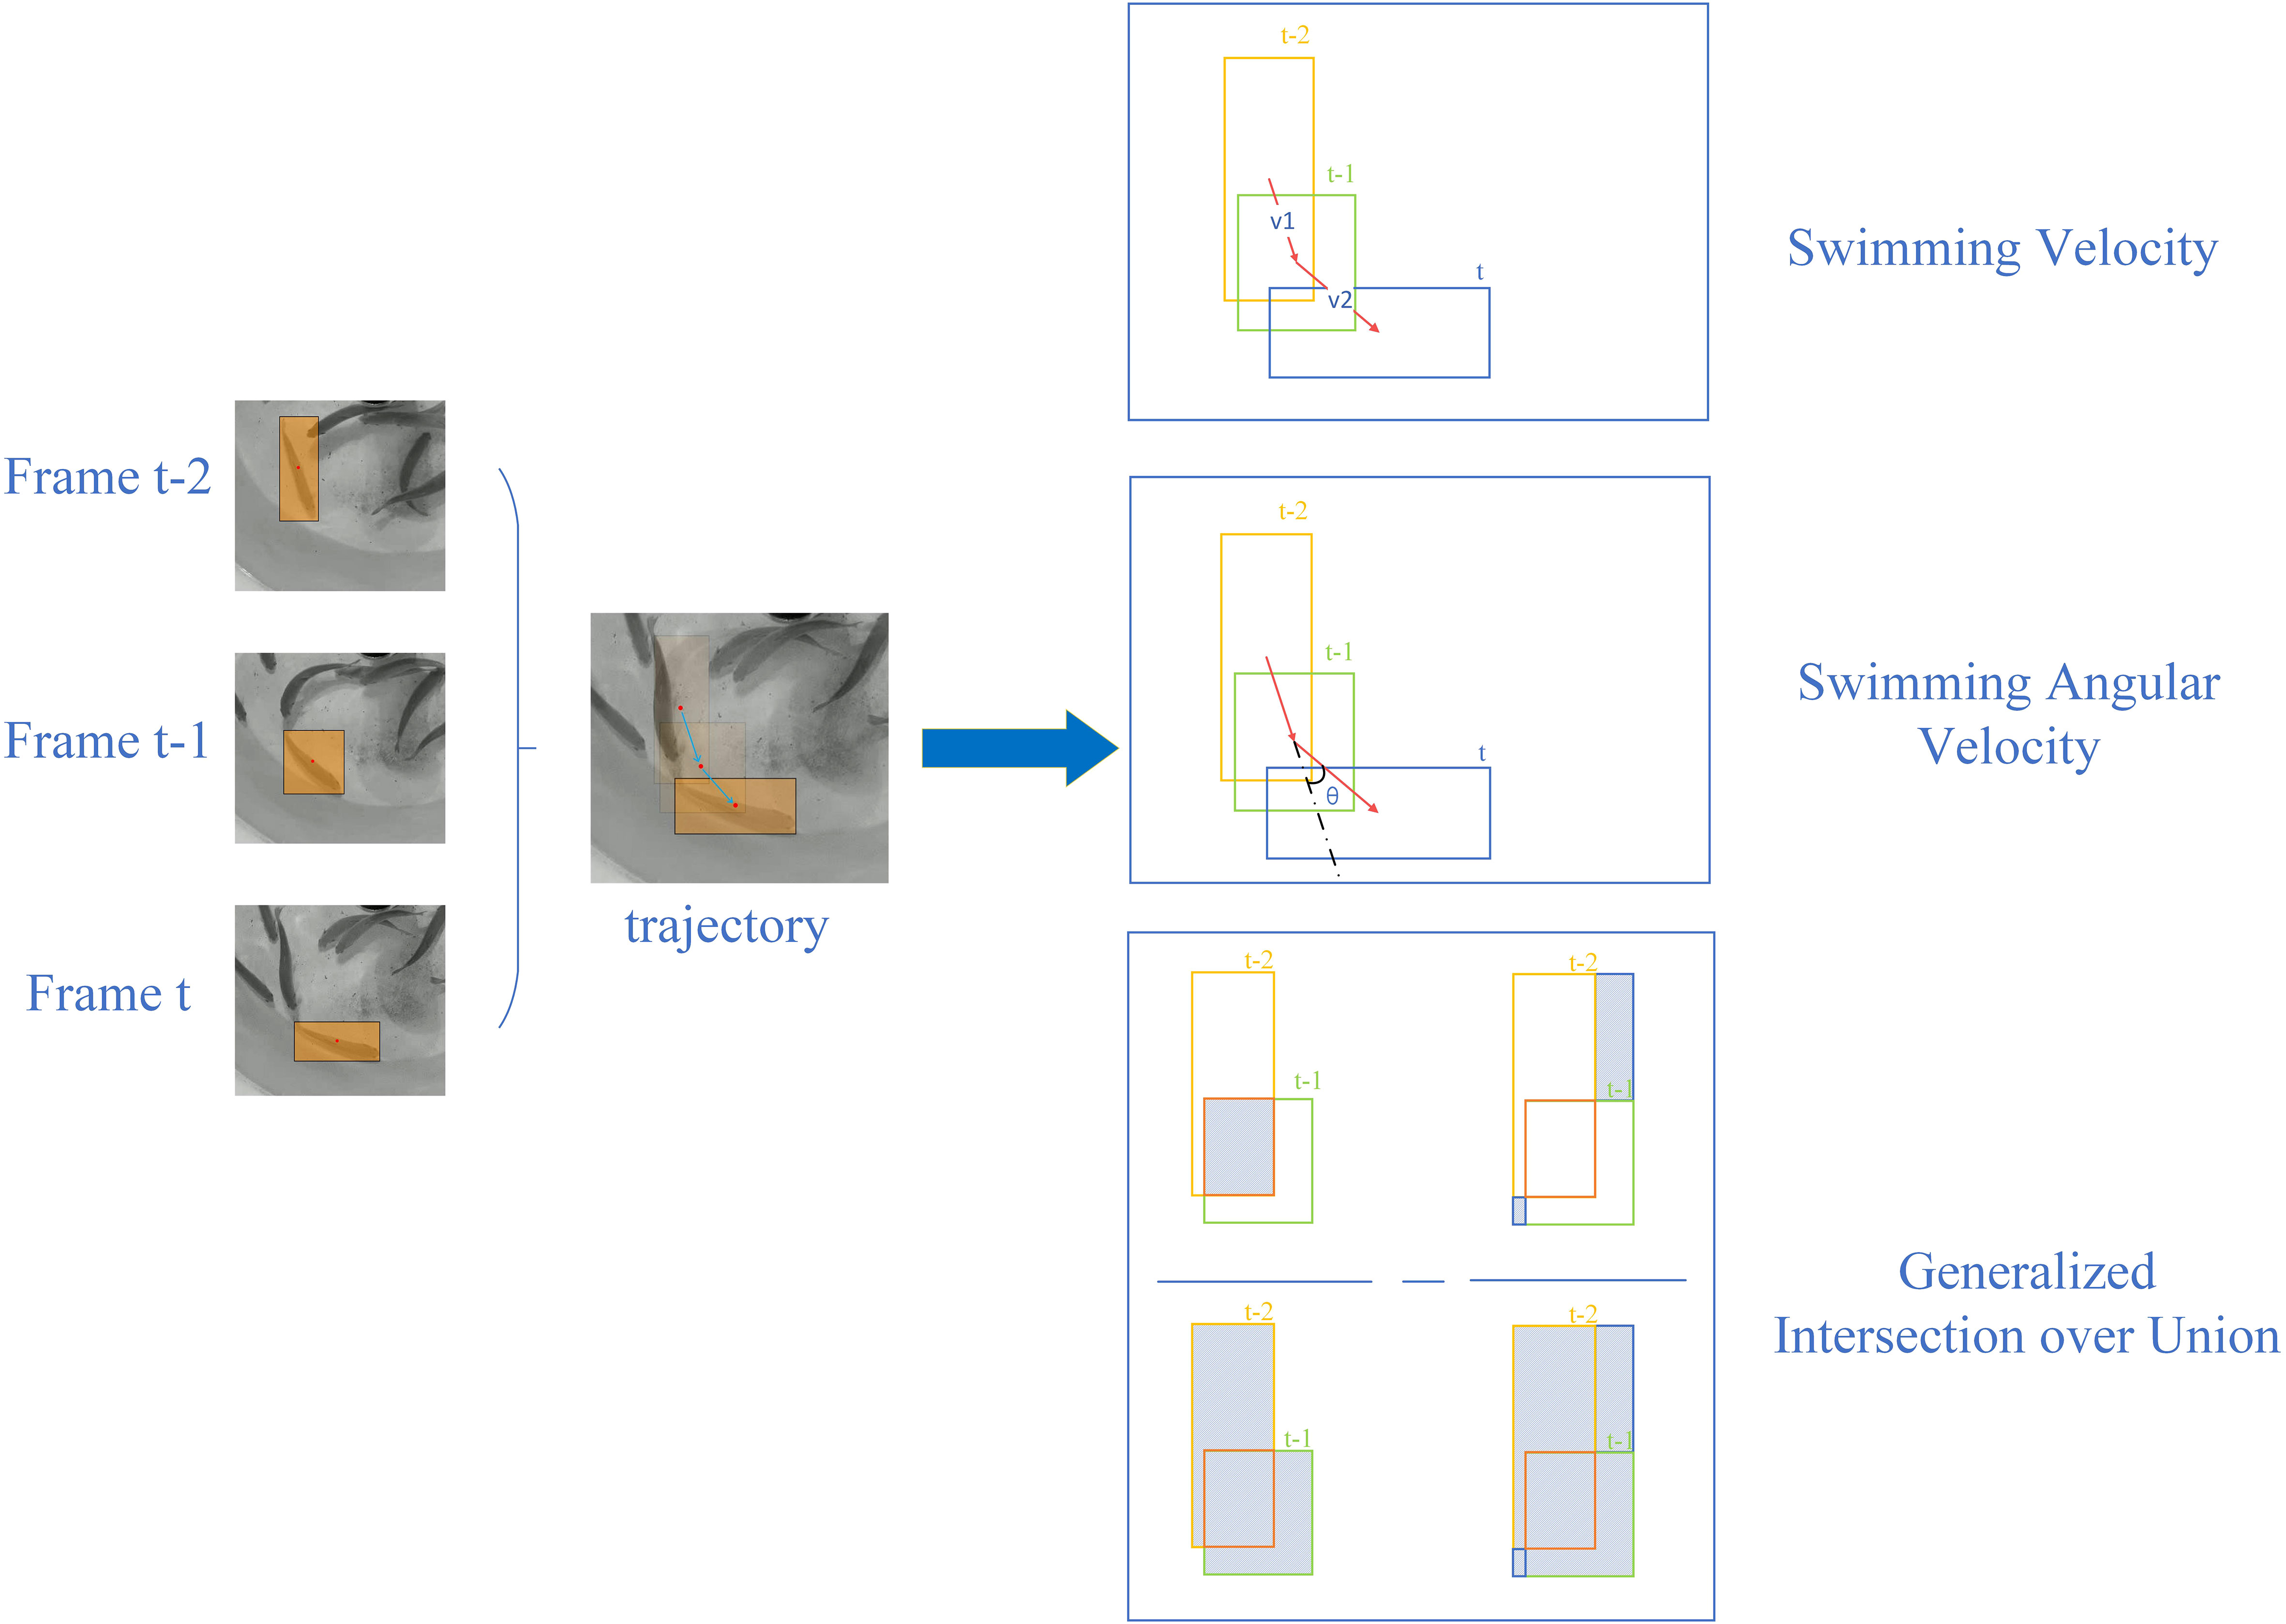
Figure 3 Behavioral metrics quantification.
2.3.2 Quantification and calculation of behavior metrics
Using the bounding boxes obtained from tracking fish videos as input, three metrics were utilized to quantify fish behavior for subsequent statistical analysis: Swimming Velocity (SV), Swimming Angular Velocity (SAV), and Generalized Intersection over Union (GIOU). These behavioral metrics can be computed over three consecutive frames, as depicted in Figure 3. A sliding window approach was employed to sequentially select M frames throughout the entire video for calculating metrics, where M represent the window size with a default value of 3.
The Swimming Velocity reflects the displacement per frame, representing the straight swimming of fish, with higher values denoting a relatively higher activity level. The Swimming Angular Velocity is the change rate in the swimming direction of the fish, representing circular swimming behavior in fish, with higher values denoting a relatively lower activity level. Employing angles and distances to study fish behavior is a commonly used method in fish behavior analysis (Hang et al., 2021). GIOU provides a composite measure of the overlap, distance, and dimension differences between two bounding boxes. Since the shape and size of the bounding box corresponds to the pose of the fish, and the displacement of the bounding box corresponds to the movement velocity of the fish, GIOU effectively encapsulates the fish behavioral dynamics. It can serve as an indicator of information representation in various fish poses and can be considered an expression of the stress response capability in fish (Huang et al., 2022).
The left side of Figure 3 shows the multiple object tracking results of a single fish across three consecutive frames, represented by moving bounding boxes that indicate the fish trajectory. On the right side, the figure illustrates the underlying principles and calculation methods for the three behavioral metrics: Swimming Velocity (SV), Swimming Angular Velocity (SAV), and Generalized Intersection over Union (GIOU). These metrics correspond to the following Equations 1, 2 and Algorithm 1.
The notation was used to denote the fish and the center motion of bounding boxes to represent the movement feature of fish swimming. means the center coordinates at frame and the swimming velocity (vfu), swimming angular velocity () of fish in three consecutive frames were calculated as described in Equation 1 and Algorithm 1.
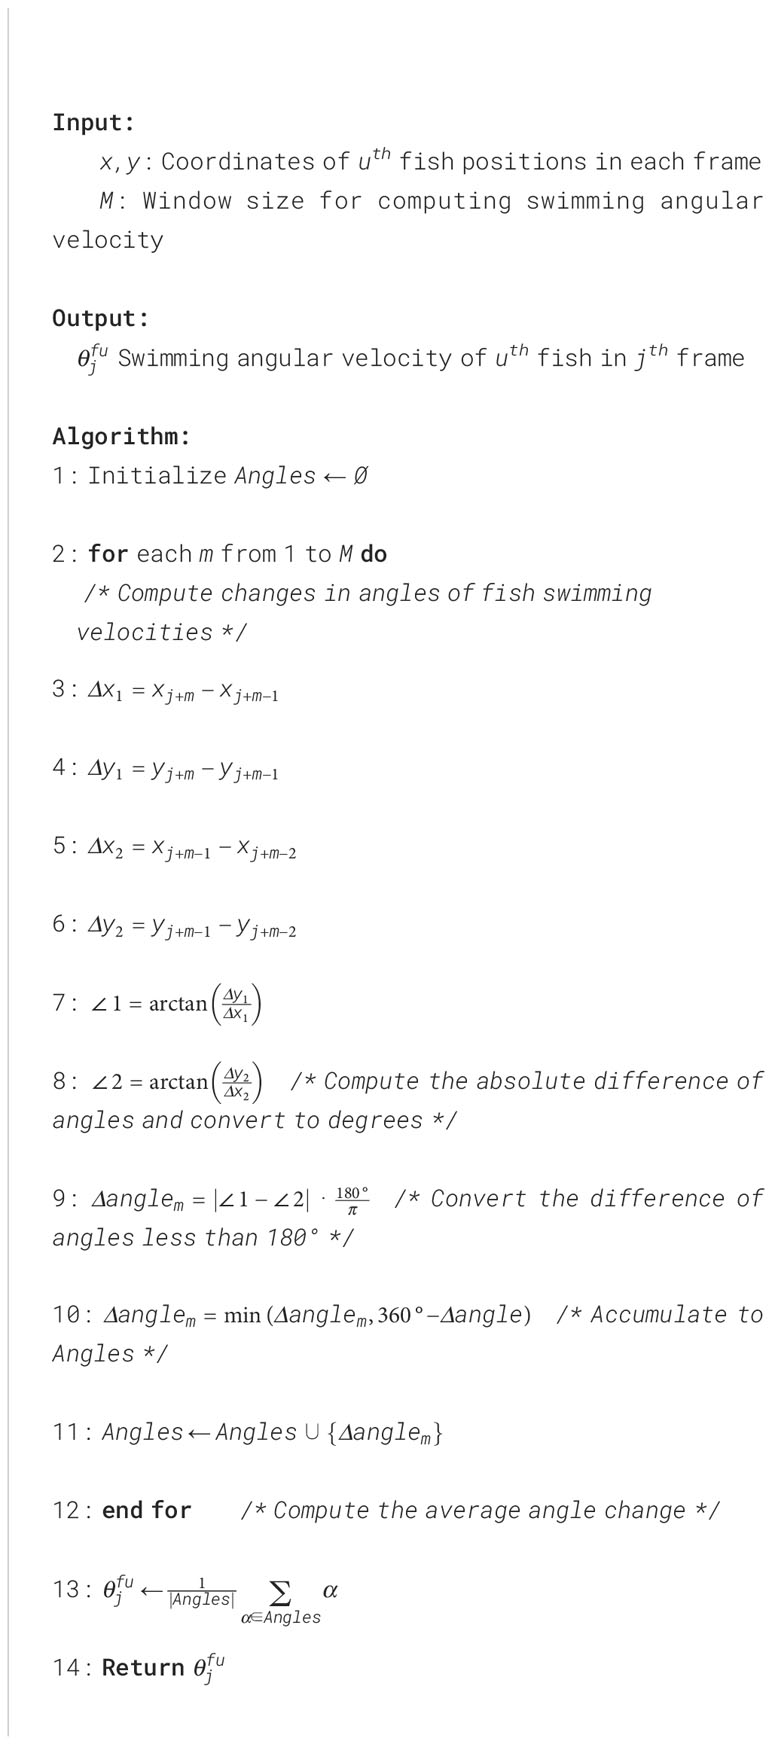
Algorithm 1 Calculate Swimming Angular Velocity of Fish.
, reflecting the degree of overlap of the fish bounding boxes in consecutive frames, which was calculated as Equation 2. denotes the area of min box which contains two bounding boxes of the same fish in consecutive two frames, is the area ratio of the intersection and union of the two bounding boxes, is the union area of the two bounding boxes.
Based on the principle and calculation of these behavioral metrics, it can be inferred that higher swimming speed indicates a higher fish activity level, while increased swimming angular velocity and GIOU values signify a reduced fish activity level. The integration of these indicators provides a comprehensive perspective to systematically evaluate the impact of different light color conditions on fish behavior by comparing the variations among groups based on these three metrics. This methodology enables us to identify the suitable light color conditions for steelhead trout.
2.3.3 Statistical analysis and methods
In the quantification of behavioral metrics, which included twelve values (12 hours per day) for each metric, two parts were conducted. The first part of the study used behavioral metrics from the last five days of the trial, serving as the final behavior effects of the first 8 weeks of the trial, for one-way analysis of variance (ANOVA). The results of the first part are in Sections 3.2 to 3.4 of the Results. The second part utilized daily data on swimming velocity, each comprising 12 hourly values. The 12W group was used as a baseline to identify when significant differences (represented by p-values) between 12W and other groups stabilized. Given the significant differences of the 12R group with other groups, the 12R group was similarly employed as a baseline for conducting the same analysis. This approach allowed for a comprehensive analysis of the effects of different lighting conditions on fish behavior from various perspectives. The results of the second part are in Sections 3.5 of the Results.
The homoscedasticity (P>0.05) of data was evaluated using the Levene test and the normality (P>0.05) of data was assessedthrough the Shapiro-Wilk test. Subsequently, the following stratified approach was adopted to assess inter-group differences: For data that conformed to both normality and homogeneity of variance, ANOVA and LSD tests were utilized; for data that adhered to normality but not to homogeneity of variance, Welch ANOVA and Games-Howell tests were employed; for data that did not meet the normality criterion, Kruskal-Wallis H test and Dunn’s Test were conducted. Statistical analyses were performed using Python packages including Scipy version 1.7.1, scikit_posthocs version 0.8.1, pingouin version 0.5.4, and statsmodels version 0.14.1, along with IBM SPSS Statistics version 25.
2.4 Animal and ethics approval
All experimental methods of this study were performed under the Regulations of the Administration of Affairs Concerning Experimental Animals of China, as well as the Regulations of the Administration of Affairs Concerning Experimental Animals of Shandong Province.
3 Results
3.1 Comparison of multiple object tracking methods
The comparative results between two Multiple Object Tracking (MOT) methods, YOLOv5+SORT and CenterTrack, are presented in Table 1. Both methods were trained and tested using a dataset collected and annotated as part of the experiment. The results showed that YOLOv5+SORT outperforms CenterTrack in the context of fish multiple object tracking within this study, evidenced by achieving a Mean Average Precision (mAP50) of 95.7%, a Multiple Object Tracking Accuracy (MOTA) of 87.4%, and an Identity F1 Score (IDF1) of 47.7%. These metrics collectively underscore the exemplary proficiency of YOLOv5+SORT method in target detection and identity association.
3.2 Swimming velocity
The effects of different light conditions on fish behavior metrics are shown in Figure 4. After the first 8 weeks of the trial, the results revealed that there was a significant difference (P< 0.01) in swimming velocity among the six light color treatments (as shown in Figure 4A). The swimming velocity of the 12R group was the highest (P< 0.01), which significantly differed from the other groups. The fish reared under the 3B9R groups had the lowest swimming velocity, which was significantly lower than that of the 12R, 12B, and 6B6R groups.
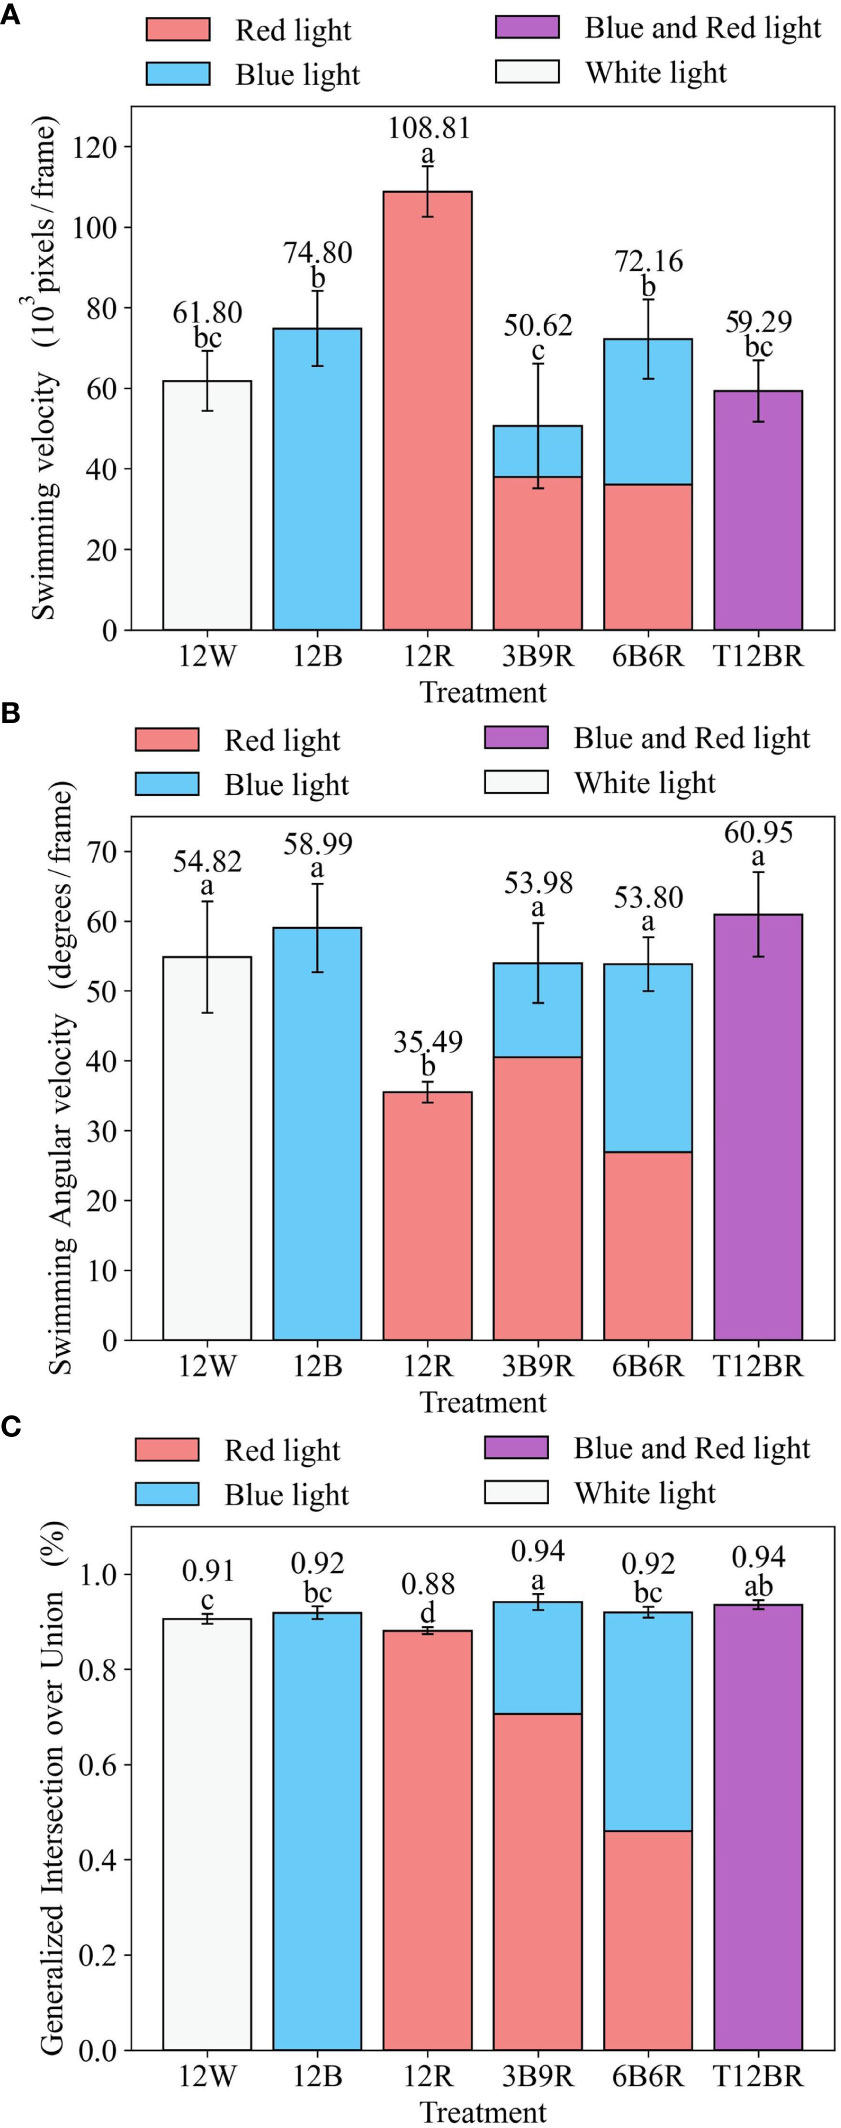
Figure 4 Swimming velocity, Swimming Angular velocity, GIOU for juvenile steelhead trout. (A) Swimming velocity (B) Swimming angular velocity (C) Generalized Intersection ove Union.
In this Figure 4, panels (a–c) are statistical analyses of fish behavioral metrics (Swimming Velocity (SV), Swimming Angular Velocity (SAV), and Generalized Intersection over Union (GIOU), respectively) at the end of the trial, reflecting the behavioral influences of fish in the trial. Different letters denote significant differences (P< 0.05) between groups based on a one-way analysis of variance (ANOVA) with the Least Significant Difference (LSD) test. Results are expressed as the mean ± standard deviation. The naming convention for treatments is derived from the arrangement of light colors within the 12-hour light period, denoted as xCyD: C color light for X hours, D color light for y hours. For instance, ‘3B9R’ denotes blue light for 3 hours and 9 hours of red light, and ‘12B’ denotes blue light for 12 hours.
3.3 Swimming angular velocity
The results indicated a significant variance in swimming angular velocities among the six light color groups (P< 0.01), as illustrated in Figure 4B. Specifically, the fish in the 12R group exhibited the slowest swimming angular velocity (P< 0.01), significantly differing from the other groups. The swimming angular velocities of the other groups were relatively similar, with T12BR displaying the highest value.
3.4 Generalized intersection over union
The results revealed significant differences in GIOU among the six light color groups (P< 0.01), as depicted in Figure 4C. The fish in the 12R group exhibited the lowest GIOU, showing a significant distinction from the other groups. Conversely, the 3B9R group had the highest GIOU, significantly differing from the 12R, 12B, 12W, and 6B6R groups.
3.5 Dynamics of swimming velocity differences among treatments
Temporal dynamics of significant differences in swimming velocity between treatment groups were demonstrated in Figures 5, 6. Specifically, Figure 5 illustrates the variations in swimming velocity p-values and metrics for the 12W group in contrast with the pure color groups (12B, 12R, and T12BR), while Figure 7 presents these comparisons for the 12W group against the mixed color groups (6B6R and 3B9R). In a parallel fashion, Figure 8 details the changes in swimming velocity p-values and metrics for the 12R group relative to the pure color groups (12B, 12W, and T12BR), and Figure 6 does the same for the 12R group when compared to the mixed color groups (6B6R and 3B9R).
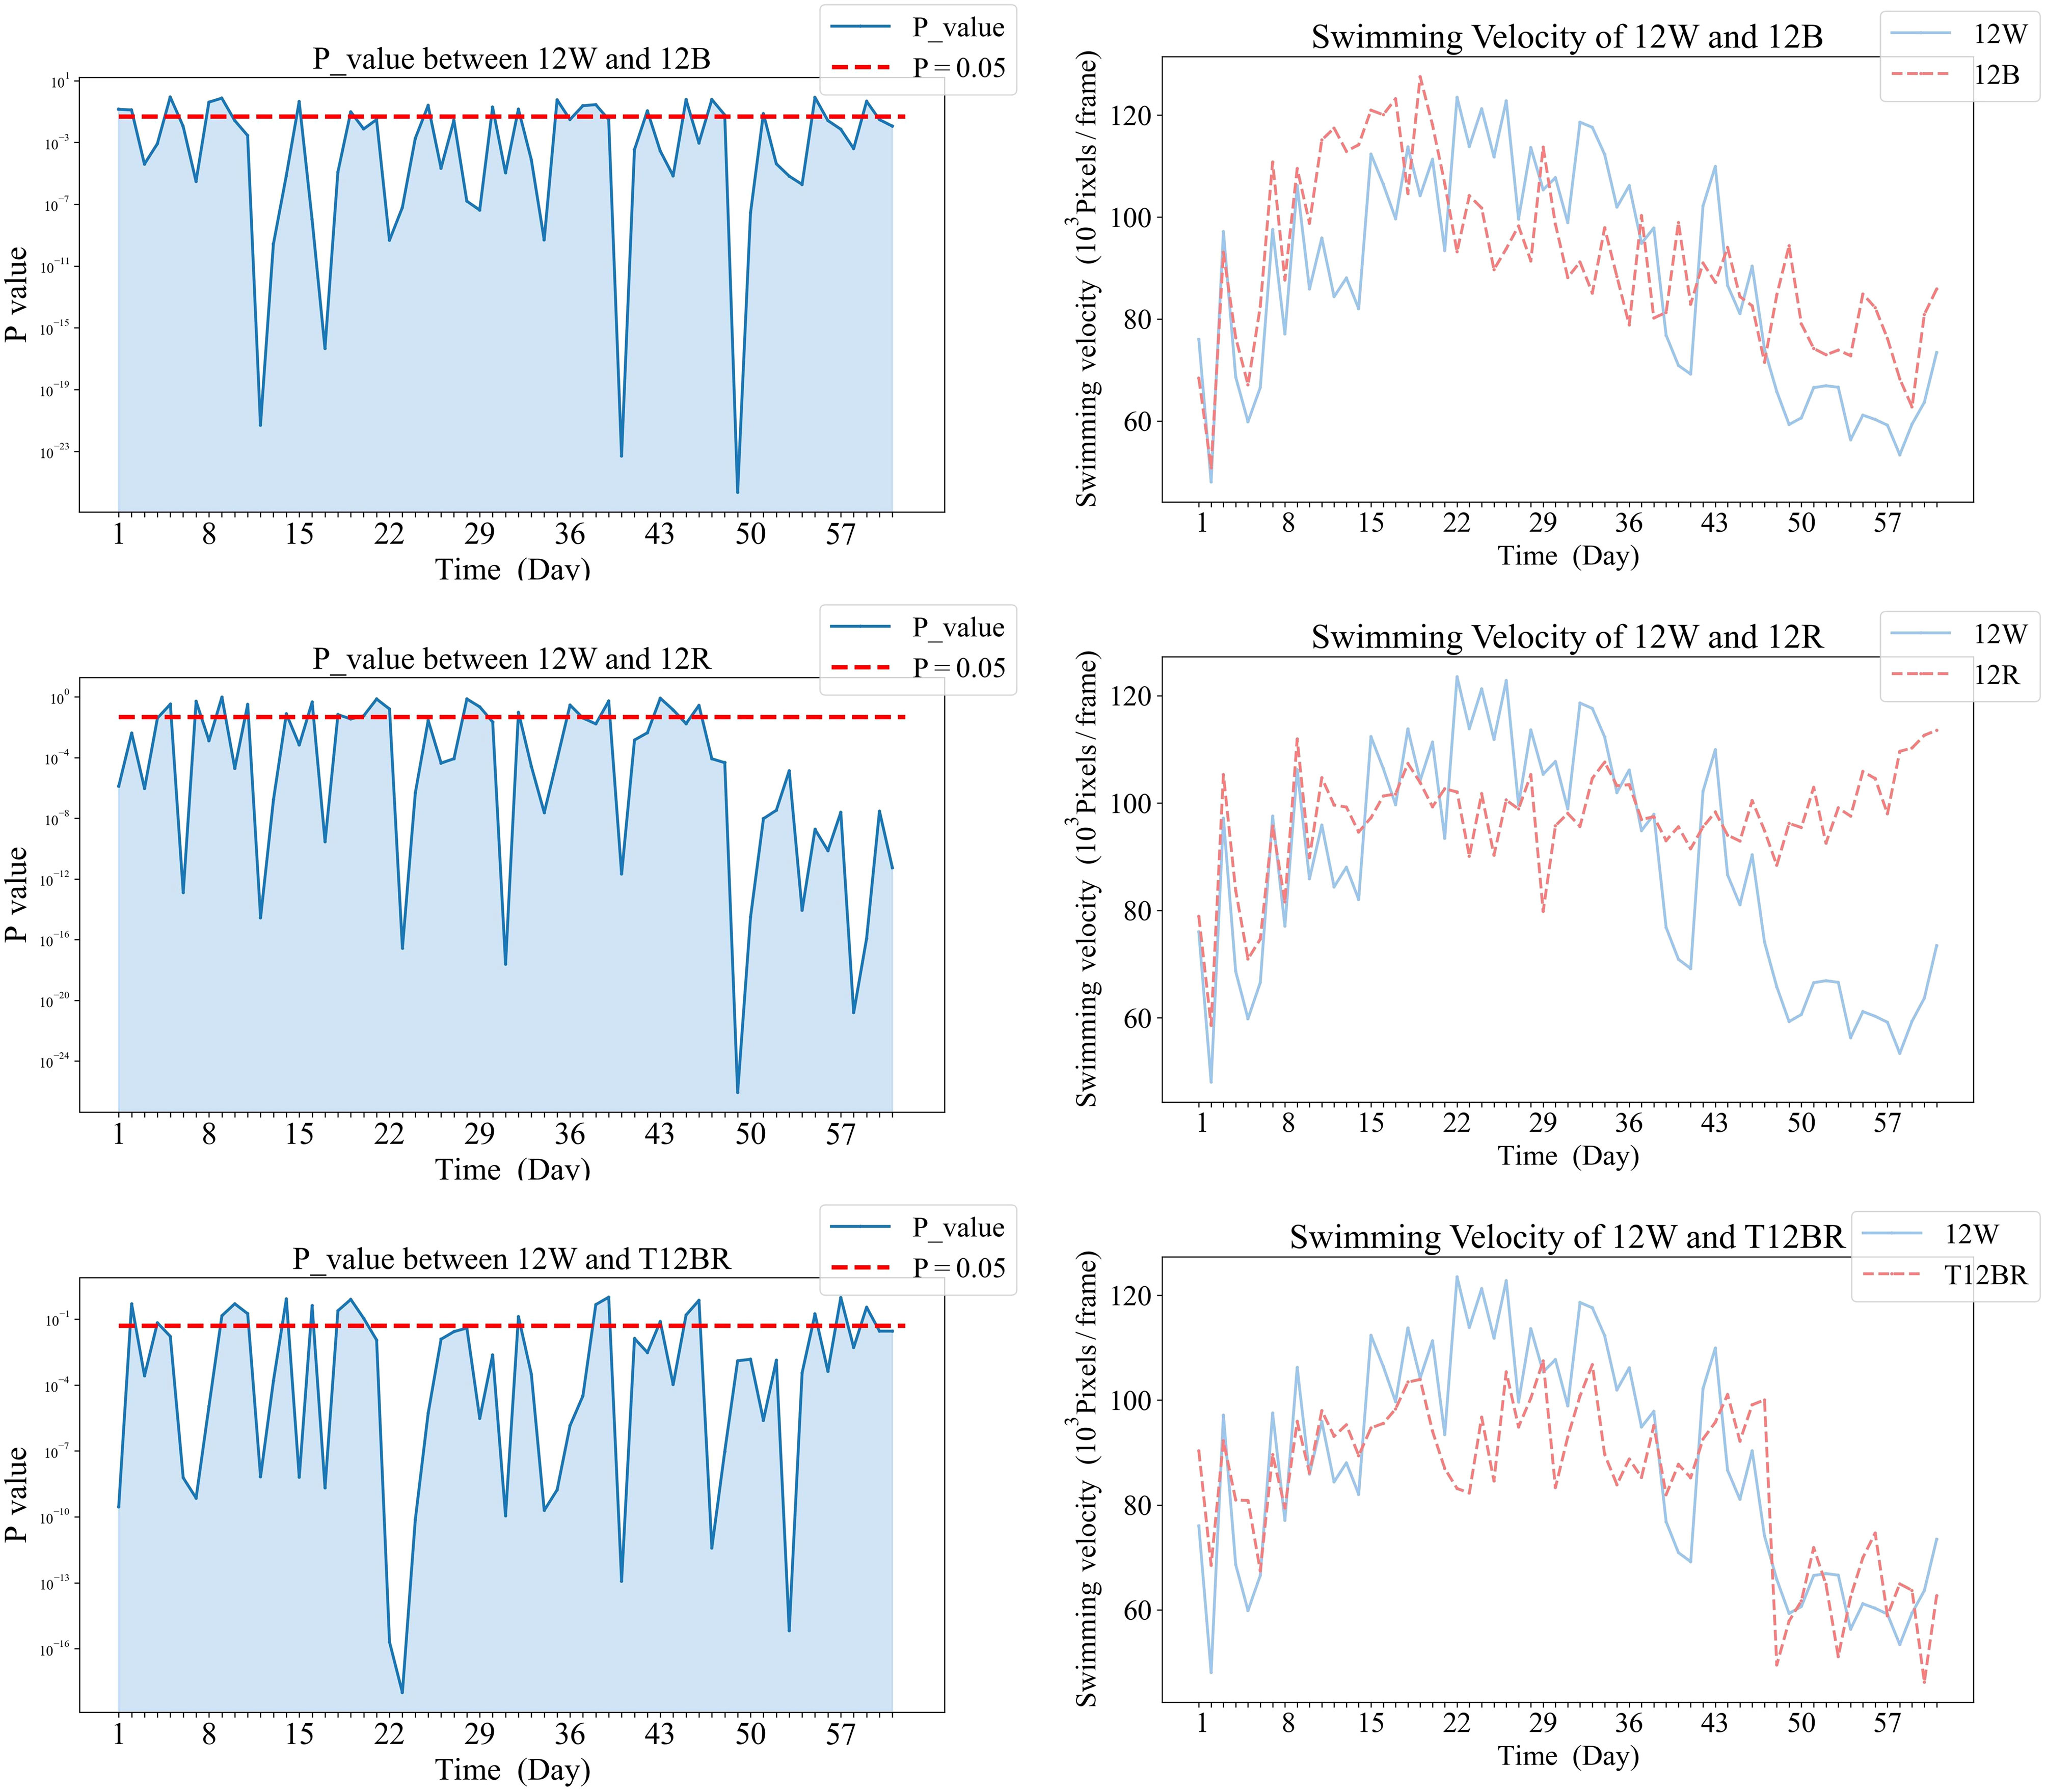
Figure 5 Comparative analysis of Swimming Velocity in 12W and pure color groups.
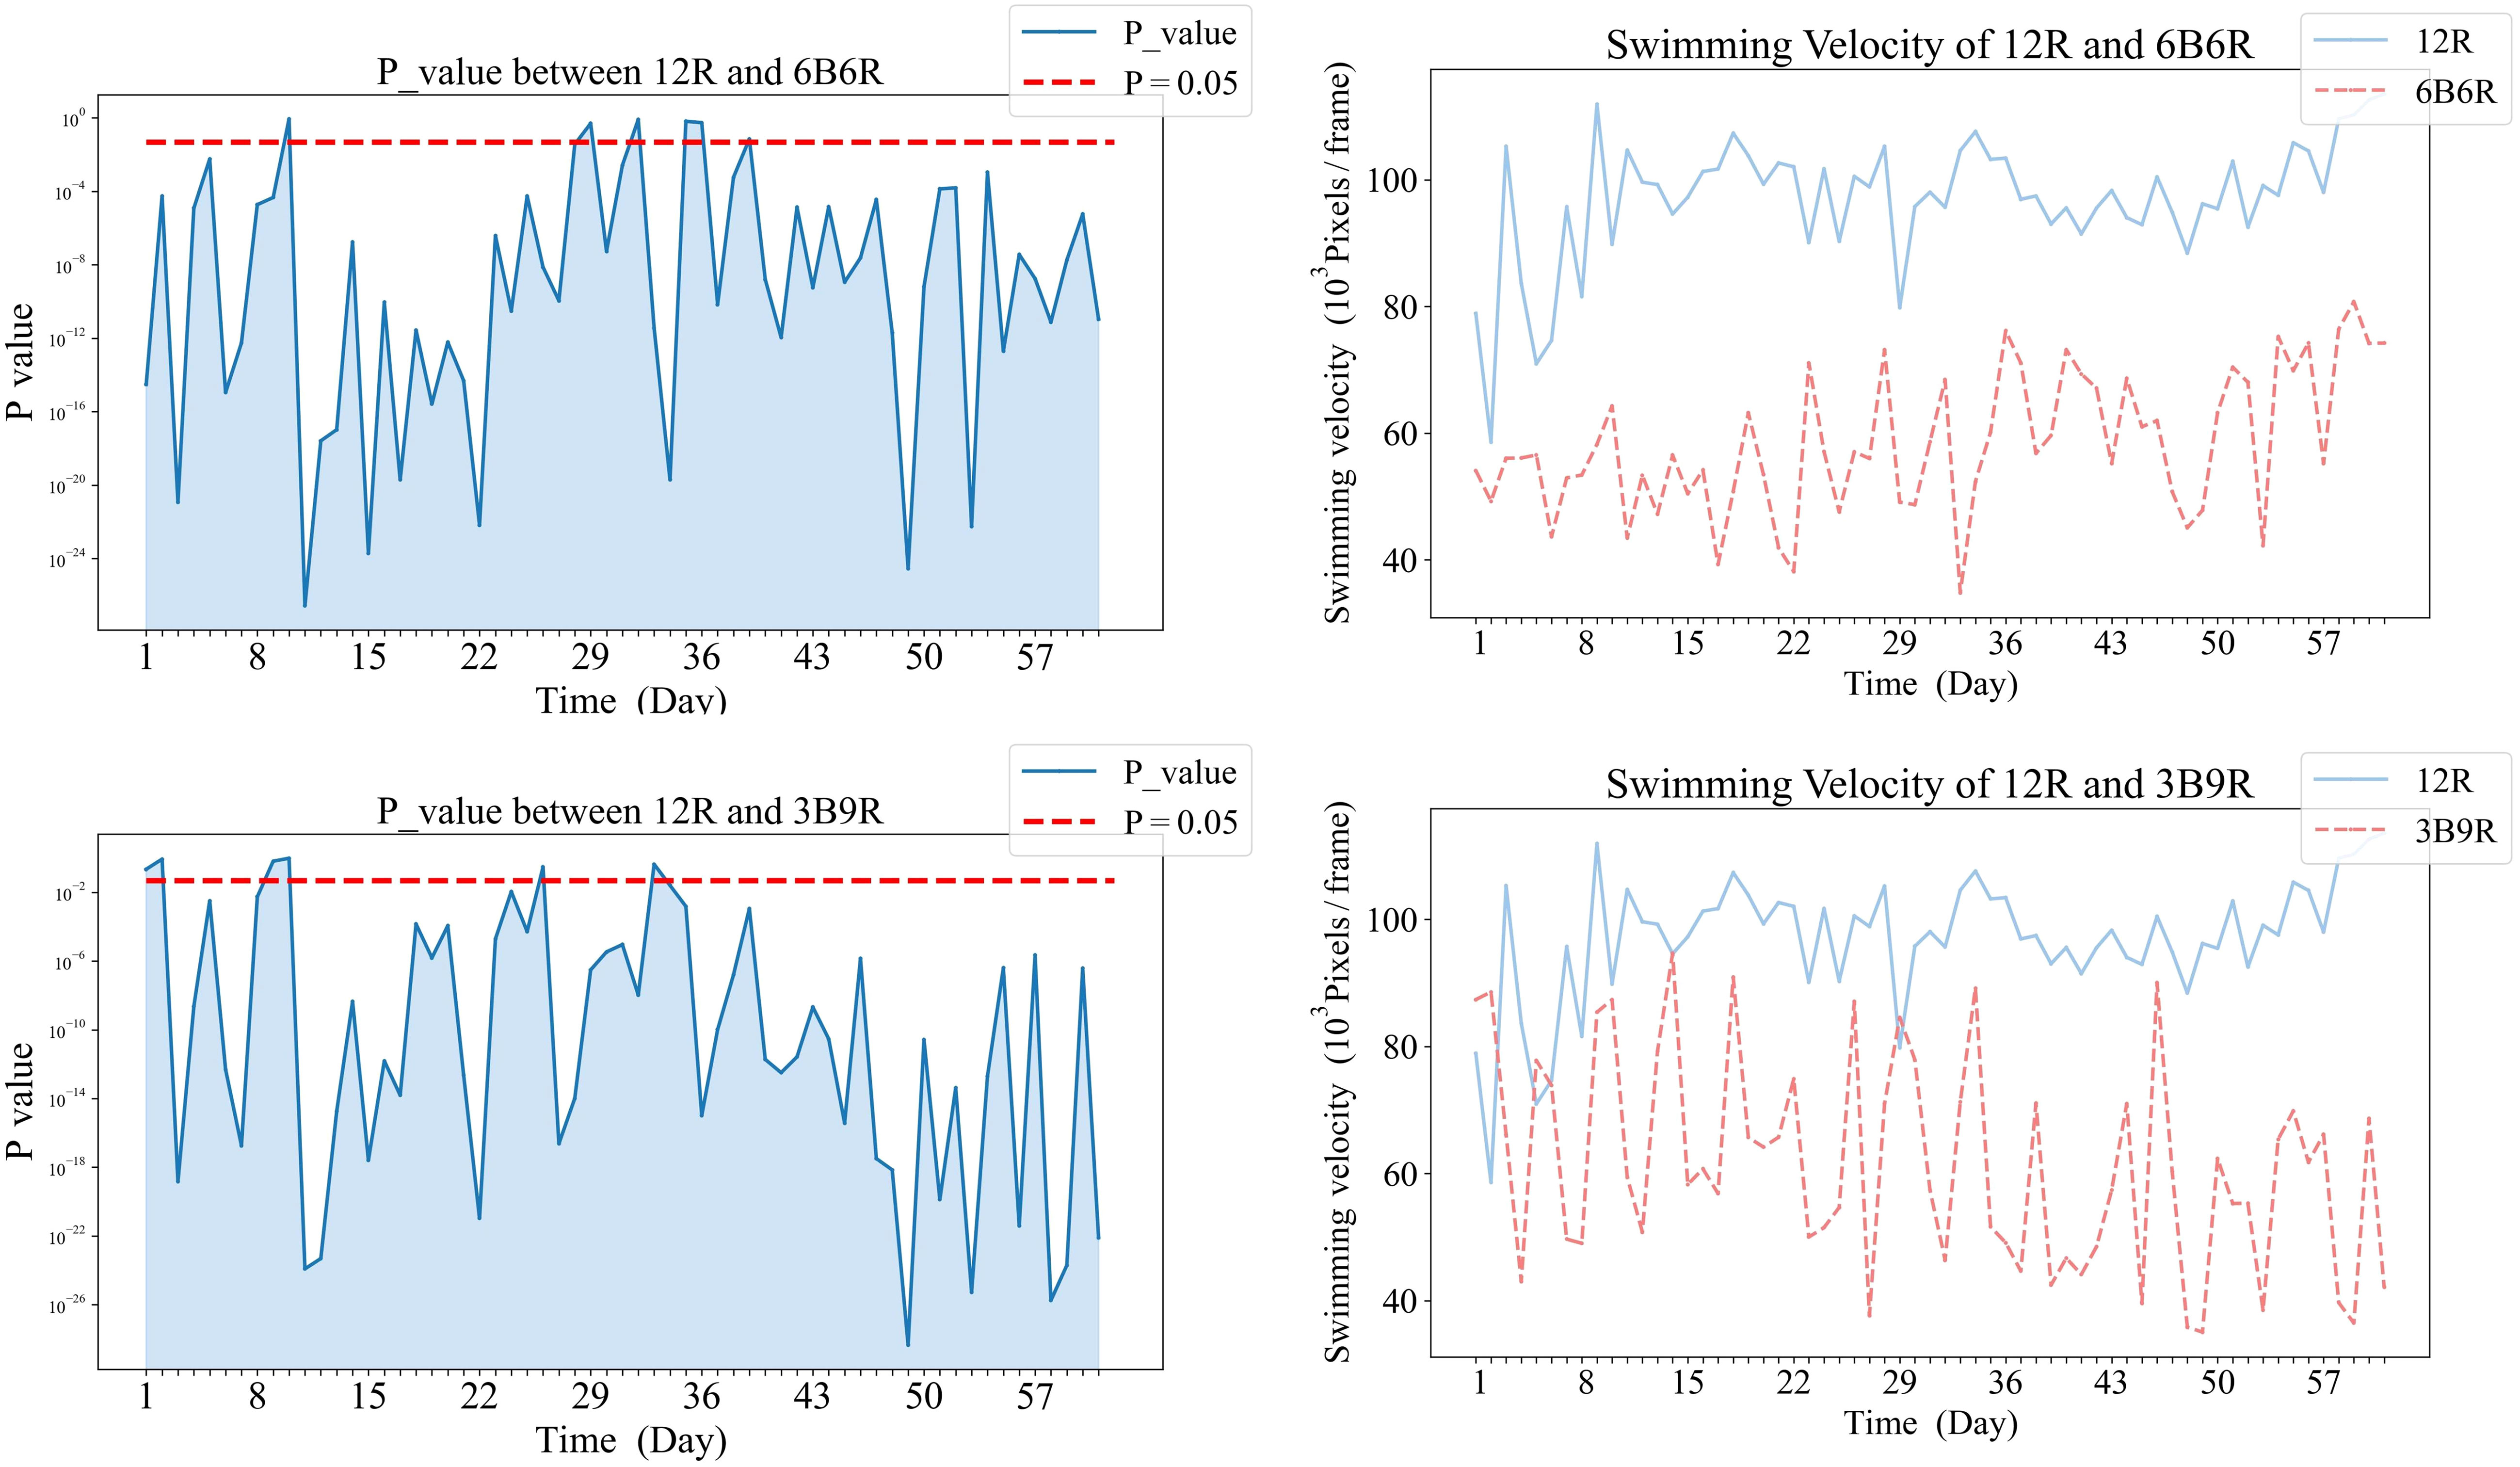
Figure 6 Comparative analysis of Swimming Velocity in 12R and mixed color groups.
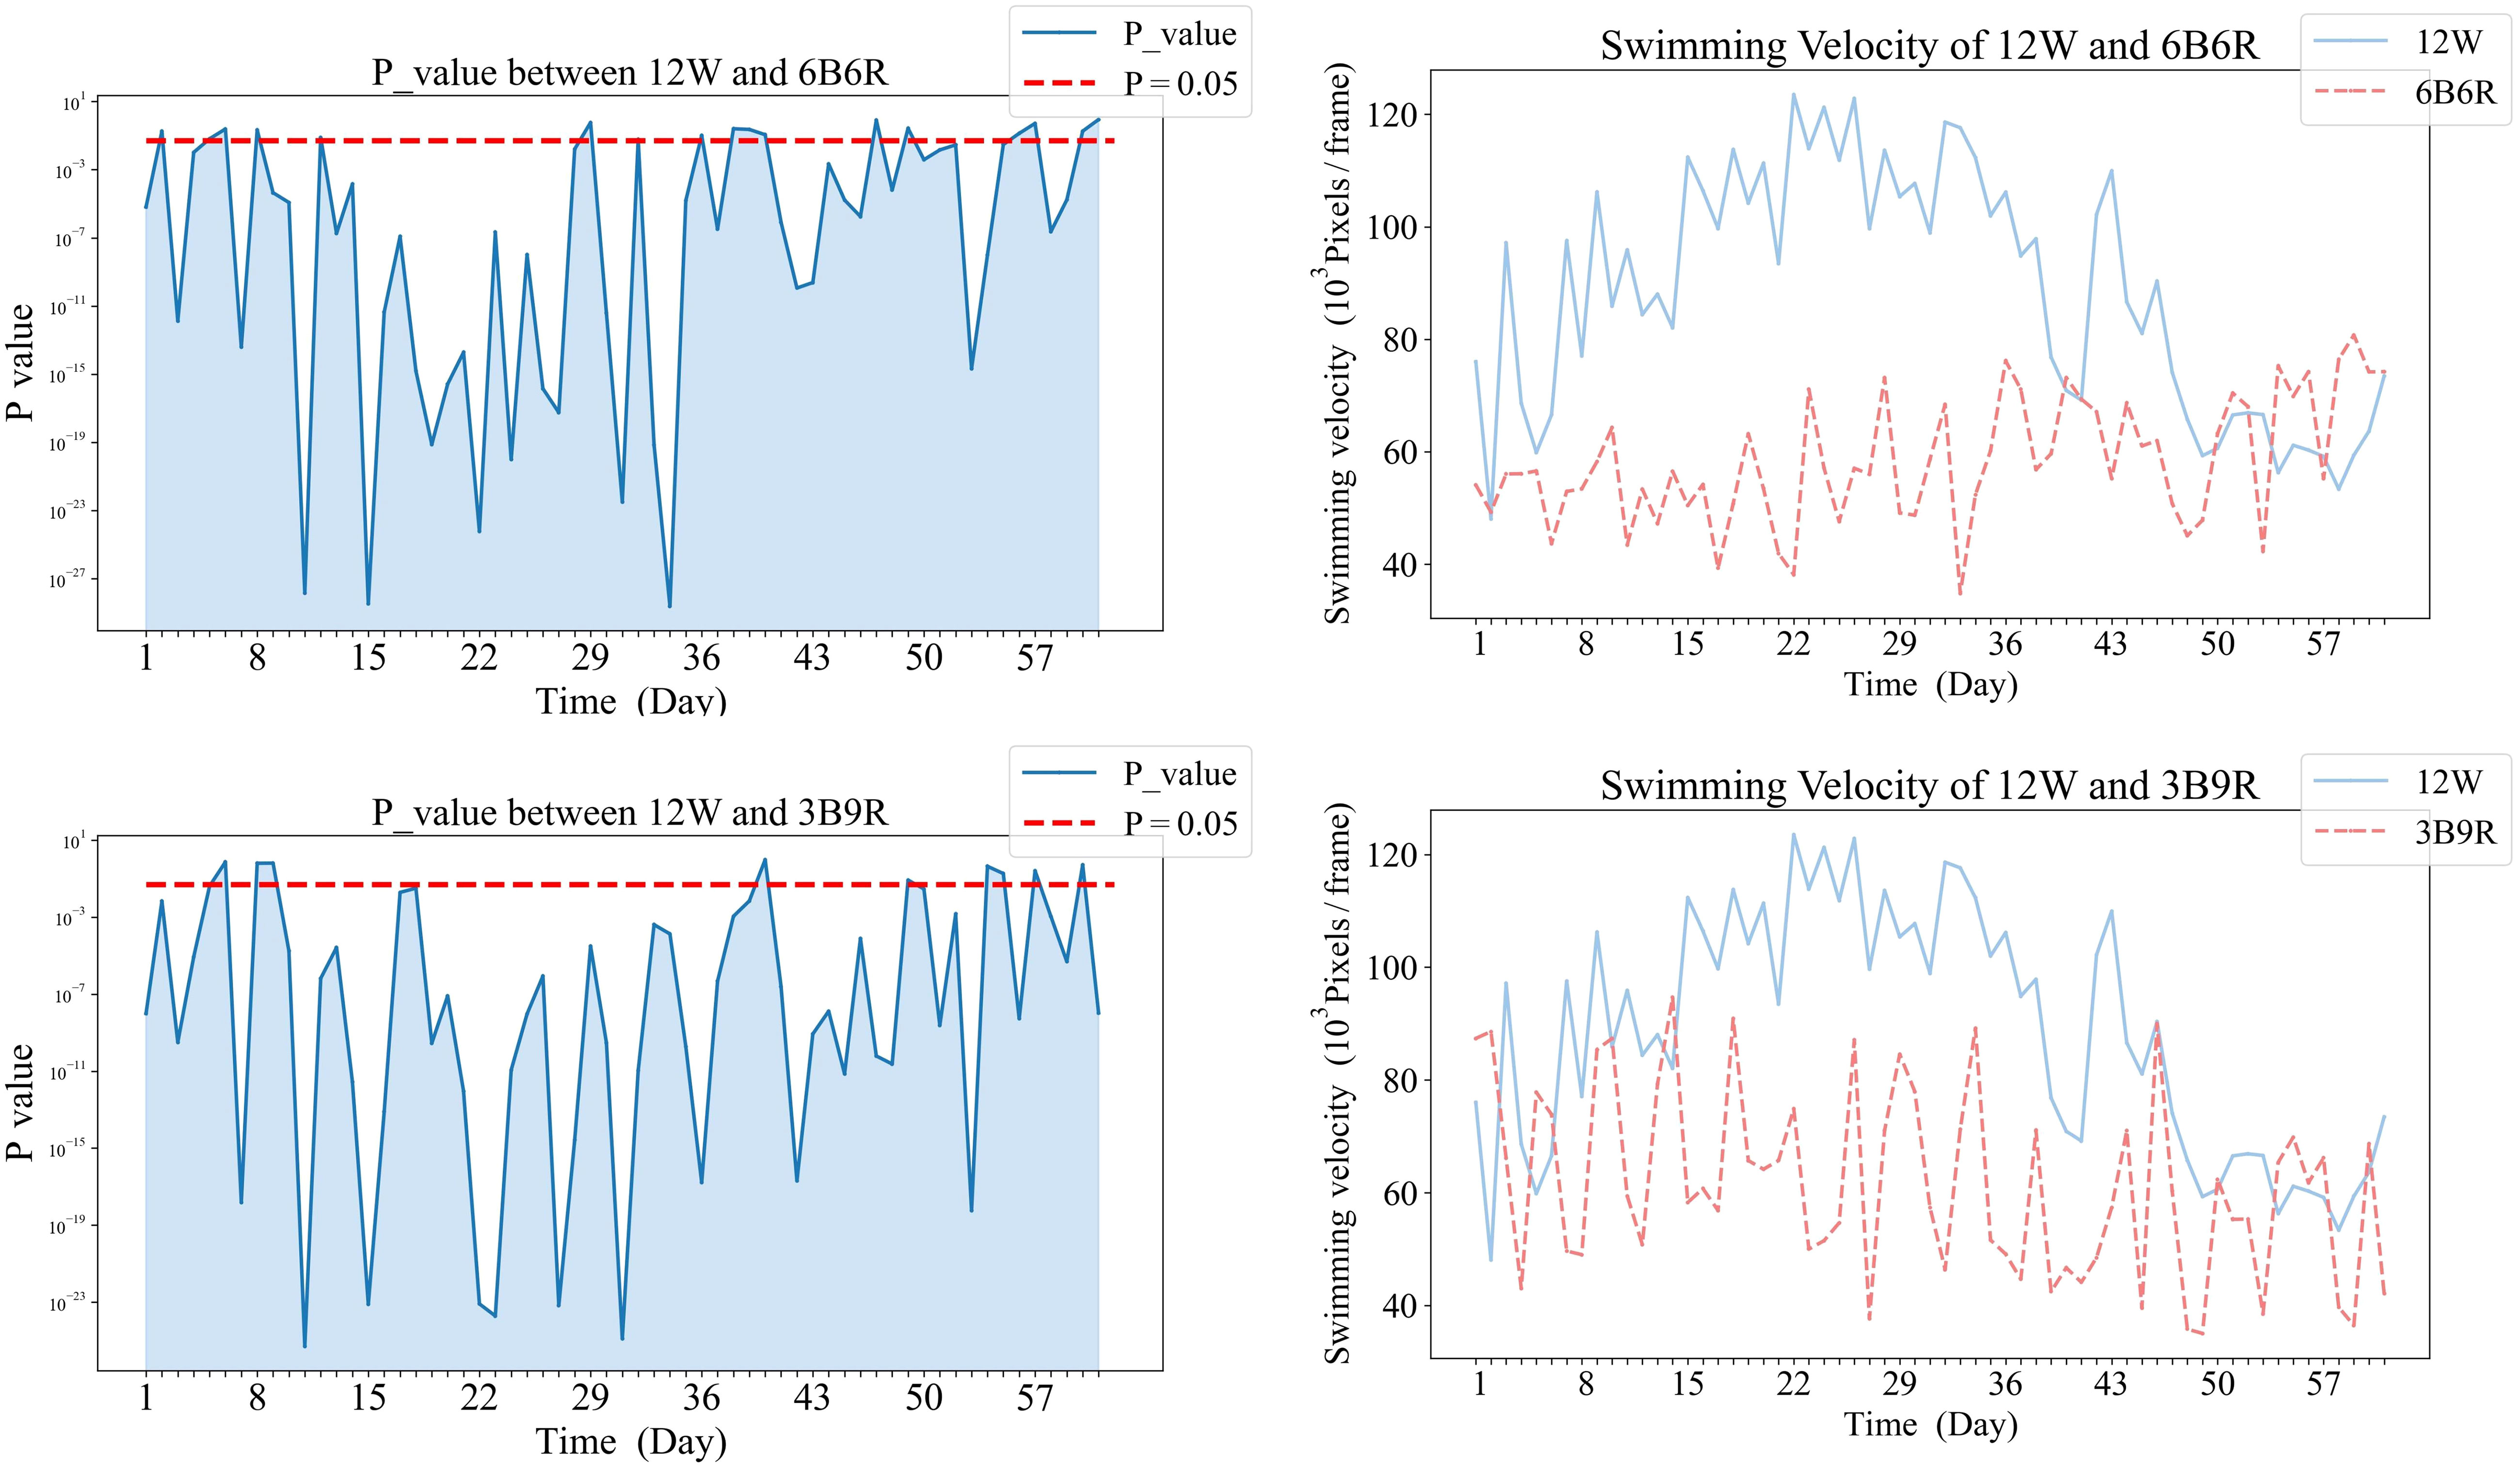
Figure 7 Comparative analysis of Swimming Velocity in 12W and mixed color groups.
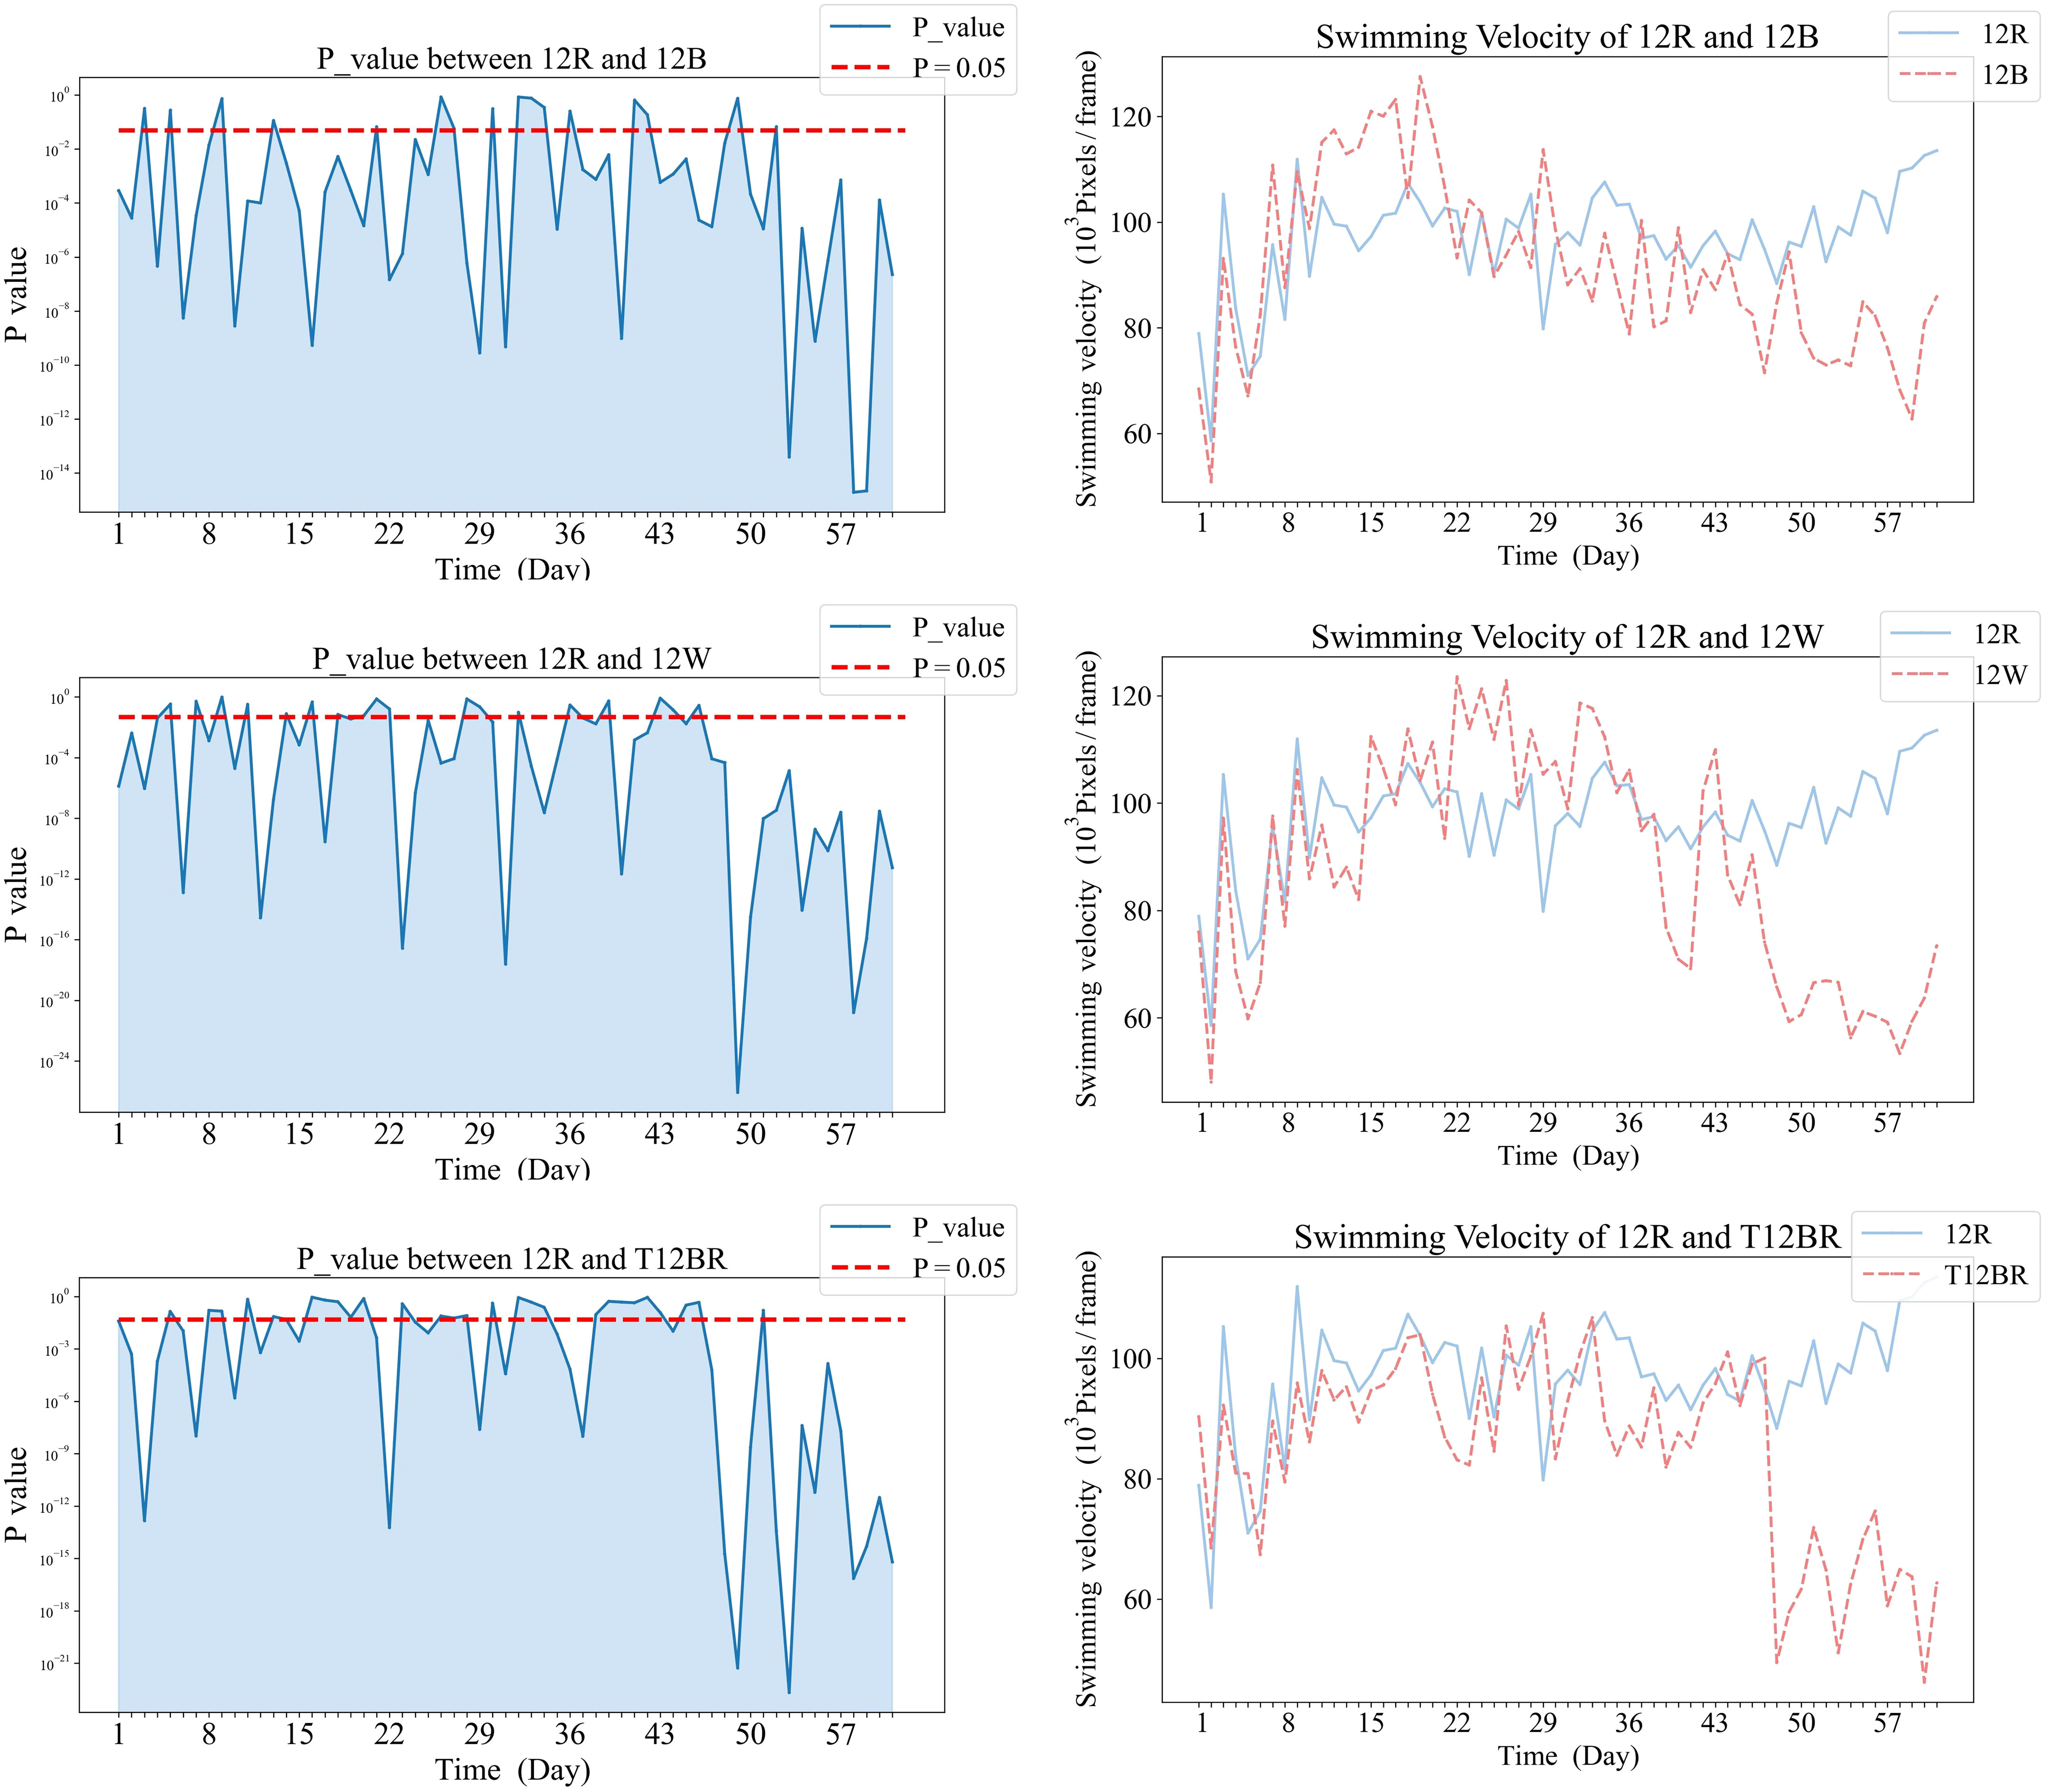
Figure 8 Comparative analysis of Swimming Velocity in 12R and pure color groups.
Comparative analysis of the 12W group revealed that stable significant differences were only observed with the 12R group by the conclusion of the trial (p<0.05). During the mid-phase of the trial (weeks 3 to 4), the 3B9R and 6B6R groups exhibited transitory significant differences when compared with the 12W group, which were not maintained in the long term.
Comparative analysis of the 12R group revealed that significant differences eventually manifested between this group and all other groups. Notably, the 3B9R and 6B6R groups displayed significant differences from the 12R group as early as the sixth week. In contrast, the 12W, 12B, and T12BR groups developed these differences more gradually, becoming apparent by the eighth week.
In Figure 5, panels (a1), (b1), and (c1) on the left display the daily variance in swimming velocity P-values between each pure color group (12B, 12R, T12BR) and the 12W group, over the initial eight-week period. Panels (a2), (b2), and (c2) on the right present the corresponding swimming velocity values for these groups compared to the 12W group across the same duration. A P-value below 0.05 is indicative of a statistically significant difference. The naming convention for treatments is derived from the arrangement of light colors within the 12-hour light period, denoted as xCyD: C color light for X hours, D color light for y hours. For instance, ‘3B9R’ denotes blue light for 3 hours and 9 hours of red light, and ‘12B’ denotes blue light for 12 hours.
In Figure 7, panels (a1), and (b1) on the left display the daily variance in swimming velocity P-values between each mixed color group (6B6R, 3B9R) and the 12W group, over the initial eight-week period. Panels (a2), and (b2) on the right present the corresponding swimming velocity values for these groups compared to the 12W group across the same duration. A P-value below 0.05 is indicative of a statistically significant difference. The naming convention for treatments is derived from the arrangement of light colors within the 12-hour light period, denoted as xCyD: C color light for X hours, D color light for y hours. For instance, ‘3B9R’ denotes blue light for 3 hours and 9 hours of red light, and ‘12B’ denotes blue light for 12 hours.
In Figure 8, panels (a1), (b1), and (c1) on the left display the daily variance in swimming velocity P-values between each pure color group (12B, 12W, T12BR) and the 12R group, over the initial eight-week period. Panels (a2), (b2), and (c2) on the right present the corresponding swimming velocity values for these groups compared to the 12R group across the same duration. A P-value below 0.05 is indicative of a statistically significant difference. The naming convention for treatments is derived from the arrangement of light colors within the 12-hour light period, denoted as xCyD: C color light for X hours, D color light for y hours. For instance, ‘3B9R’ denotes blue light for 3 hours and 9 hours of red light, and ‘12B’ denotes blue light for 12 hours.
In Figure 6, panels (a1), and (b1) on the left display the daily variance in swimming velocity P-values between each mixed color group (6B6R, 3B9R) and the 12R group, over the initial eight-week period. Panels (a2), and (b2) on the right present the corresponding swimming velocity values for these groups compared to the 12R group across the same duration. A P-value below 0.05 is indicative of a statistically significant difference. The naming convention for treatments is derived from the arrangement of light colors within the 12-hour light period, denoted as xCyD: C color light for X hours, D color light for y hours. For instance, ‘3B9R’ denotes blue light for 3 hours and 9 hours of red light, and ‘12B’ denotes blue light for 12 hours.
4 Discussion
In this study, the behavioral responses of steelhead trout under various light color combinations (12B, 12R, 12W, 3B9R, T12BR, 6B6R) were investigated to identify the most suitable light environment for steelhead trout cultivation. Light color is a significant factor in aquatic environments, with numerous studies investigating its effects on the physiology and behavior of cultured fish species. For example, A study on the impacts of blue, red, green, white, and natural sunlight on goldfish (Carassius auratus) found that blue light facilitated better growth and lower ventilation frequencies (Noureldin et al., 2021). It was found that steelhead trout are not recommended to be cultured under blue light, as it was associated with a reduction in liver total lipids and plasma glucose levels, along with an increase in serotonergic and dopaminergic activity in the brain (Karakatsouli et al., 2007). Meanwhile, another study found that steelhead trout exhibited good growth performance under yellow light Heydarnejad et al., 2013, indicating that different light colors have varying effects on steelhead trout. In contrast, this study found that the fish in the 12R group exhibited the highest swimming velocity and the lowest swimming angular velocity and GIOU, with significant differences (P< 0.05) from the other groups. This indicates that fish under red light exhibit the highest amount of movement, preferring to swim over a large area rather than slowly wandering in a small radius. In the comparative analysis with the 12W group, it was found that only the 12R group exhibited significant differences with 12W in the end, indicating that red light has a greater behavioral impact on fish, as shown in Figures 5, 7.
Previous research has also discovered that steelhead trout exhibit an avoidance behavior towards red light (Luchiari and Pirhonen, 2008). The unique behavioral responses of steelhead trout under red light environment could potentially be explained by the physiological impacts of red light on fish. Several studies have found that under red light, steelhead trout exhibit hepatic stress, indicated by higher levels of alkaline phosphatase (ALP) (P< 0.05), total bilirubin (T-BIL) (P< 0.05), alanine aminotransferase (ALT), lysophosphatidic acid (LPA), and malondialdehyde (MDA) (Chen et al., 2022b); and hepatic oxidative stress, indicated by significantly decreased activities of catalase (CAT), glutathione peroxidase (GPx), glucose-6-phosphate dehydrogenase (G6PD), glutathione reductase (GR), glutathione S-transferase (GST), and acetylcholinesterase (AChE) in the liver (Guller et al., 2020).
The linkage between red light exposure and heightened fish activity may be a consequence of hepatic stress. As the liver plays a pivotal role in metabolic processes, its impaired function due to stress or oxidative damage may increase fish activity levels, likely as a stress response. Notably, this pattern of behavior under red light is not unique to steelhead trout. Similar hepatic stress responses have been observed in turbot (Scophthalmus maximus) (Wu et al., 2021), with juveniles exhibiting increased levels of Hsp70 mRNA and antioxidant enzymes when exposed to red and orange spectra. Moreover, goldfish (Carassius auratus) exposed to red light displayed reduced growth rates and heightened ventilation frequencies (Noureldin et al., 2021). Tiger puffer (Takifugu rubripes), too, exhibited avoidance behaviors to long-wavelength red light, with their movement rates correlating directly with light wavelength (Cai et al., 2023), echoing the increased activity levels noted in this study. These collective findings underscore the significant influence of red light on fish behavior and physiology. However, the specific mechanisms underpinning these effects, particularly how red light-induced hepatic stress and oxidative damage translate into altered behavior, warrant further investigation.
Beyond the impact of monochromatic light on fish, some studies have also investigated the effects of combinations of light colors on fish. For instance, a study on the influence of red, blue, green, white light, and three mixed light combinations on Nile tilapia (Elkadom et al., 2023), found that the growth performance under red/blue light was superior, whereas red light exhibited poorer growth performance, causing significant liver inflammation and damage, showing some similarities with this study. In contrast, this research investigates the effects of different light color combinations on the behavior of steelhead trout. It was discovered that the 3B9R group exhibited the lowest swimming velocity and highest GIOU, indicating lower activity level and exercise expenditure than other groups. It has also been found (Chen et al., 2022b) that the 3B9R environment showed the best growth performance and no hepatic stress. This may be attributable to the spectral distribution under 3B9R conditions more closely to the natural light spectrum in trout habitats, thereby avoiding excessive stimulation and consequently resulting in lower activity levels. The spectral distribution of light in water is influenced by climatic conditions, incident angles, depth, and water quality (Liu et al., 2016; Hou et al., 2019). Light penetration in water varies with its wavelength; red light has poorer penetration. Due to longer light paths at dawn and dusk compared to noon (Wetzel, 1983; Ruchin, 2020), blue light dominates at the same depth in the morning and evening, while red light prevails at noon, which is similar to the light color distribution under the 3B9R condition. Thereby, 3B9R was considered a suitable light environment for trout cultivation.
In the comparative analysis based on the 12W and 12R groups, distinct behavioral patterns were observed in the mixed light groups (6B6R, 3B9R) as opposed to the pure light groups (12B, 12W, 12R, T12BR). Specifically, the results reveal that in the comparisons with the 12W group (showed in Figures 5, 7), mixed light groups (6B6R, 3B9R) briefly showed significant differences with 12W during the mid-term phase of the experiment, which subsequently disappeared, unlike the pure light groups (12B, 12R, T12BR). In the comparisons with the 12R group (showed in Figures 8, 6), the mixed color groups (6B6R, 3B9R) established long-term stable significant differences earlier, emerging by the sixth week, whereas the pure color groups (12B, 12W, T12BR) formed these differences at a later stage, becoming apparent by the eighth week, indicating a two-week advancement for the former. The key difference between mixed and pure light groups lies in the fact that 12W, 12B, 12R, and T12BR environments all provided light with constant spectral distribution, that is, a pure color light without spectral change (T12BR offers blue and red light, akin to violet light). In contrast, the 3B9R and 6B6R environments’ light colors both have a blue-red-blue change, which might have led to the unique behavioral patterns observed in the mixed light groups. Previous research on the biochemical characteristics (Chen et al., 2022a) has found that fish in 3B9R and 6B6R environments showed myocardial stress with higher levels of lactate dehydrogenase (LDH). This physiological response may be correlated with the unique behavioral patterns of the mixed light groups. It suggests that a gradual light color transition phase is needed to facilitate fish adaptation and environments like 3B9R, and 6B6R should be cautious of abrupt light color changes.
Environmental light impacts fish behavior through the nervous system. Usually, light is detected by the eyes and the signal is send to the brain for processing and interpretation. Some studies have delved into the effects of different environmental light colors on fish brain histology. For example, it was analyzed the brain histology of Nile tilapia under various light color environments and observed that red light exposure led to adverse histological changes in the brain (Elkadom et al., 2023), including significant neuronal degeneration, cerebral hemorrhaging, and pronounced lesions. Conversely, fish exposed to red and blue light showed excellent cytoarchitecture. This may offer a potential explanation from a neurological and histological perspective for the negative results seen in this experiment under the 12R red light environment and the positive effects under the 6B6R and 3B9R red and blue light combinations. Further exploration is needed to deeply understand the mechanisms behind how light color influences fish behavior through the nervous system and brain histology.
This study currently still has several limitations, such as the accuracy of the MOT methods that could be further improved due to the lack of high-quality fish datasets. The behavioral metrics used primarily pertain to swimming behaviors of fish, with a dearth of metrics directly reflecting fish group interactions. Moreover, the internal mechanisms through which light affects histological, physiological, and biochemical features by impacting their neurological systems, leading to behvaioral performance, remain unclear. In future research, more efficient and precise fish multiple object tracking methods could be employed, and additional fish behavior indicators could be proposed to comprehensively reflect both swimming behaviors and group interactions of fish. This would allow for a deeper investigation into the effects of light on the histological, physiological, and biochemical aspects of fish, and the underlying mechanisms of changes in fish behavior traits, thereby enhancing the understanding of fish behavior.
5 Conclusion
In the present study, the effects of various light color combinations on the behavior of juvenile steelhead trout were explored, integrating the analysis of how light color impacts on fish growth, physiology, and histology. Behavioral differences were discovered to emerge significantly earlier than physiological ones, manifesting as early as week eight. Notably, a distinct behavioral change was observed under the red light (12R) environment, characterized by increased swimming activity, which suggested the potential stress and discomfort experienced by trout. Consequently, the 12R environment appeared less favorable for long-term cultivation. Conversely, the mixed color light condition 3B9R, closely mimicked the natural light spectrum preferred by trout in their natural habitats, presenting a suitable light environment for steelhead trout cultivation where gradual light color transitions could help avoid stress. Existing brain histological analyses of fish also support these behavioral findings, particularly the adverse changes in brain histology observed under red light exposure contrasted sharply with more favorable outcomes under red and blue light conditions. Future research should continue to investigate the multifaceted effects of light on aquacultural species, employing more efficient and precise MOT methods for fish trajectory tracking. By utilizing more comprehensive behavioral metrics to quantify fish behavior, further studies can explore the potential relationships between fish behavior, physiology, and histology to identify more suitable aquacultural lighting environments, thereby enhancing fish welfare and productivity.
Data availability statement
The raw data supporting the conclusions of this article will be made available by the authors, without undue reservation.
Ethics statement
All experimental methods of this study were performed under the Regulations of the Administration of Affairs Concerning Experimental Animals of China, as well as the Regulations of the Administration of Affairs Concerning Experimental Animals of Shandong Province. The study was conducted in accordance with the local legislation and institutional requirements.
Author contributions
ZL: Data curation, Formal analysis, Investigation, Methodology, Software, Visualization, Writing – original draft. XC: Writing – review & editing, Investigation, Methodology. JH: Methodology, Software, Writing – review & editing. DA: Writing – review & editing. YZ: Writing – review & editing.
Funding
The author(s) declare financial support was received for the research, authorship, and/or publication of this article. This work was supported by the National Key R&D Program of China (Grant No. 2022YFE0107100).
Conflict of interest
The authors declare that the research was conducted in the absence of any commercial or financial relationships that could be construed as a potential conflict of interest.
Publisher’s note
All claims expressed in this article are solely those of the authors and do not necessarily represent those of their affiliated organizations, or those of the publisher, the editors and the reviewers. Any product that may be evaluated in this article, or claim that may be made by its manufacturer, is not guaranteed or endorsed by the publisher.
References
Baekelandt S., Mandiki S. N. M., Schmitz M., Kestemont P. (2019). Influence of the light spectrum on the daily rhythms of stress and humoral innate immune markers in pikeperch Sander lucioperca. Aquaculture 499, 358–363. doi: 10.1016/j.aquaculture.2018.09.046
Bewley A., Ge Z., Ott L., Ramos F., Upcroft B. (2016). “Simple online and realtime tracking,” in 2016 IEEE International Conference on Image Processing (ICIP). AZ, USA: Phoenix. 3464–3468. doi: 10.1109/ICIP.2016.7533003
Bugert R. M., Bjornn T. C., Meehan W. R. (1991). Summer habitat use by young salmonids and their responses to cover and predators in a small southeast alaska stream. Trans. Am. Fisheries Soc. 120, 474–485. doi: 10.1577/1548-8659(1991)120<0474:Shubys>2.3.Co;2
Cai H., Zhang Y., Xiong Y., Liu Y., Sun F., Zhou Q., et al. (2023). Preference of juvenile tiger puffer for light spectrum and tank colours based on different body size and breeding background. Animal 17, 101021. doi: 10.1016/j.animal.2023.101021
Chen X., Zhou Y., Huang J., An D., Li L., Dong Y., et al. (2022a). Blue and red light color combinations can enhance certain aspects of digestive and anabolic performance in juvenile steelhead trout oncorhynchus mykiss. Front. Mar. Sci. 9. doi: 10.3389/fmars.2022.853327
Chen X., Zhou Y., Huang J., An D., Li L., Dong Y., et al. (2022b). The effects of blue and red light color combinations on the growth and immune performance of juvenile steelhead trout, Oncorhynchus mykiss. Aquaculture Rep. 24, 101156. doi: 10.1016/j.aqrep.2022.101156
Elkadom E. M., Abd El-Kader M. F., Bakr B. A., Abozeid A. M., Mohamed R. A. (2023). Impacts of various single and mixed colors of monochromatic LED light on growth, behavior, immune-physiological parameters, and liver and brain histology of Nile tilapia fingerlings. Aquaculture 577, 740007. doi: 10.1016/j.aquaculture.2023.740007
Gong L., Hu Z., Zhou X. (2022). "A few samples underwater fish tracking method based on semi-supervised and attention mechanism," in 2022 6th international conference on robotics, control and automation (ICRCA). (Xiamen, China: IEEE), 18–22. doi: 10.1109/ICRCA55033.2022.9828911
Guller U., Onalan S., Arabaci M., Karatas B., Yasar M., Kufrevioglu O. I. (2020). Effects of different LED light spectra on rainbow trout (Oncorhynchus mykiss): in vivo evaluation of the antioxidant status. Fish Physiol. Biochem. 46, 2169–2180. doi: 10.1007/s10695-020-00865-x
Hang S., Zhao J., Ji B., Li H., Zhang Y., Peng Z., et al. (2021). Impact of underwater noise on the growth, physiology and behavior of Micropterus salmoides in industrial recirculating aquaculture systems. Environ. pollut. 291, 118152. doi: 10.1016/j.envpol.2021.118152
Hartman G. F. (1965). The Role of Behavior in the Ecology and Interaction of Underyearling Coho Salmon (Oncorhynchus kisutch) and Steelhead Trout (Salmo gairdneri). J. Fisheries Res. Board Canada 22, 1035–1081. doi: 10.1139/f65-095
Head A. B., Malison J. A. (2007). Effects of lighting spectrum and disturbance level on the growth and stress responses of yellow perch perca flavescens. J. World Aquaculture Soc. 31, 73–80. doi: 10.1111/j.1749-7345.2000.tb00700.x
Heydarnejad M. S., Fattollahi M., Khoshkam M. (2017). Influence of light colours on growth and stress response of pearl gourami Trichopodus leerii under laboratory conditions. J. Ichthyol. 57, 908–912. doi: 10.1134/S0032945217060054
Heydarnejad M. S., Parto M., Pilevarian A. A. (2013). Influence of light colours on growth and stress response of rainbow trout (Oncorhynchus mykiss) under laboratory conditions. J. Anim. Physiol. Anim. Nutr. (Berl) 97, 67–71. doi: 10.1111/j.1439-0396.2011.01243.x
Hou Z.-S., Wen H.-S., Li J.-F., He F., Li Y., Qi X., et al. (2019). Effects of photoperiod and light Spectrum on growth performance, digestive enzymes, hepatic biochemistry and peripheral hormones in spotted sea bass (Lateolabrax maculatus). Aquaculture 507, 419–427. doi: 10.1016/j.aquaculture.2019.04.029
Huang J., Yu X., Chen X., An D., Zhou Y., Wei Y. (2022). Recognizing fish behavior in aquaculture with graph convolutional network. Aquacul. Eng. 98, 102246. doi: 10.1016/j.aquaeng.2022.102246
Jocher G., Chaurasia A., Stoken A., Borovec J., Kwon Y., Michael K., et al. (2022). ultralytics/yolov5: v6. 2-yolov5 classification models, apple m1, reproducibility, clearml and deci. ai integrations. Zenodo. doi: 10.5281/zenodo.7002879
Karakatsouli N., Papoutsoglou S. E., Pizzonia G., Tsatsos G., Tsopelakos A., Chadio S., et al. (2007). Effects of light spectrum on growth and physiological status of gilthead seabream Sparus aurata and rainbow trout Oncorhynchus mykiss reared under recirculating system conditions. Aquacul. Eng. 36, 302–309. doi: 10.1016/j.aquaeng.2007.01.005
Li J., Chen W., Zhu Y., Xuan K., Li H., Zeng N. (2023). Intelligent detection and behavior tracking under ammonia nitrogen stress. Neurocomputing 559, 126809. doi: 10.1016/j.neucom.2023.126809
Li X., Hao Y., zhang P., Akhter M., Li D. (2022). A novel automatic detection method for abnormal behavior of single fish using image fusion. Comput. Electron. Agric. 203, 107435. doi: 10.1016/j.compag.2022.107435
Li W., Li F., Li Z. (2022). CMFTNet: Multiple fish tracking based on counterpoised JointNet. Comput. Electron. Agric. 198, 107018. doi: 10.1016/j.compag.2022.107018
Li D., Wang G., Du L., Zheng Y., Wang Z. (2022). Recent advances in intelligent recognition methods for fish stress behavior. Aquacul. Eng. 96, 102222. doi: 10.1016/j.aquaeng.2021.102222
Li D., Wang Z., Wu S., Miao Z., Du L., Duan Y. (2020). Automatic recognition methods of fish feeding behavior in aquaculture: A review. Aquaculture 528, 735508. doi: 10.1016/j.aquaculture.2020.735508
Liu Y., Li B., Zhou X., Li D., Duan Q. (2024). FishTrack: Multi-object tracking method for fish using spatiotemporal information fusion. Expert Syst. Appl. 238, 122194. doi: 10.1016/j.eswa.2023.122194
Liu X., Zhang Y., Shi K., Lin J., Zhou Y., Qin B. (2016). Determining critical light and hydrologic conditions for macrophyte presence in a large shallow lake: The ratio of euphotic depth to water depth. Ecol. Indic. 71, 317–326. doi: 10.1016/j.ecolind.2016.07.012
Luchiari A. C., Oliveira J. J. (2014). The interaction of innate and imposed colour perception: a behavioural approach. J. Ethol. 32, 179–183. doi: 10.1007/s10164-014-0407-3
Luchiari A. C., Pirhonen J. (2008). Effects of ambient colour on colour preference and growth of juvenile rainbow trout Oncorhynchus mykiss (Walbaum). J. Fish Biol. 72, 1504–1514. doi: 10.1111/j.1095-8649.2008.01824.x
Mandel T., Jimenez M., Risley E., Nammoto T., Williams R., Panoff M., et al. (2023). Detection confidence driven multi-object tracking to recover reliable tracks from unreliable detections. Pattern Recognit. 135, 109107. doi: 10.1016/j.patcog.2022.109107
Mu X., Zhen W., Li X., Cao P., Gong L., Xu F. (2019). A study of the impact of different flow velocities and light colors at the entrance of a fish collection system on the upstream swimming behavior of juvenile grass carp. Water 11, 322. doi: 10.3390/w11020322
Norton W. H., Gutiérrez H. C. (2019). The three-spined stickleback as a model for behavioural neuroscience. PloS One 14, e0213320. doi: 10.1371/journal.pone.0213320
Norton W. H., Stumpenhorst K., Faus-Kessler T., Folchert A., Rohner N., Harris M. P., et al. (2011). Modulation of Fgfr1a signaling in zebrafish reveals a genetic basis for the aggression–boldness syndrome. J. Neurosci. 31, 13796–13807. doi: 10.1523/JNEUROSCI.2892-11.2011
Noureldin S. M., Diab A. M., Salah A. S., Mohamed R. A. (2021). Effect of different monochromatic LED light colors on growth performance, behavior, immune-physiological responses of gold fish, Carassius auratus. Aquaculture 538, 736532. doi: 10.1016/j.aquaculture.2021.736532
Ruchin A. B. (2020). Effect of illumination on fish and amphibian: development, growth, physiological and biochemical processes. Rev. Aquaculture 13, 567–600. doi: 10.1111/raq.12487
Ruggerone G. T., Quinn T. P., McGregor I. A., Wilkinson T. D. (1990). Horizontal and vertical movements of adult steelhead trout, Oncorhynchus mykiss, in the Dean and Fisher channels, British Columbia. Can. J. Fisheries Aquat. Sci. 47, 1963–1969. doi: 10.1139/f90-221
Sanchez-Vazquez F. J., Lopez-Olmeda J. F., Vera L. M., Migaud H., Lopez-Patino M. A., Miguez J. M. (2019). Environmental cycles, melatonin, and circadian control of stress response in fish. Front. Endocrinol. (Lausanne) 10. doi: 10.3389/fendo.2019.00279
Takahashi A., Kasagi S., Murakami N., Furufuji S., Kikuchi S., Mizusawa K., et al. (2016). Chronic effects of light irradiated from LED on the growth performance and endocrine properties of barfin flounder Verasper moseri. Gen. Comp. Endocrinol. 232, 101–108. doi: 10.1016/j.ygcen.2016.01.008
Takahashi A., Kasagi S., Murakami N., Furufuji S., Kikuchi S., Mizusawa K., et al. (2018). Effects of different green light intensities on the growth performance and endocrine properties of barfin flounder Verasper moseri. Gen. Comp. Endocrinol. 257, 203–210. doi: 10.1016/j.ygcen.2017.04.003
Villamizar N., Blanco-Vives B., Migaud H., Davie A., Carboni S., Sánchez-Vázquez F. J. (2011). Effects of light during early larval development of some aquacultured teleosts: A review. Aquaculture 315, 86–94. doi: 10.1016/j.aquaculture.2010.10.036
Wang Z., Xia C., Lee J. (2021). Parallel fish school tracking based on multiple appearance feature detection. Sensors (Basel) 21, 3476. doi: 10.3390/s21103476
Wang H., Zhang S., Zhao S., Lu J., Wang Y., Li D., et al. (2022a). Fast detection of cannibalism behavior of juvenile fish based on deep learning. Comput. Electron. Agric. 198, 107033. doi: 10.1016/j.compag.2022.107033
Wang H., Zhang S., Zhao S., Wang Q., Li D., Zhao R. (2022b). Real-time detection and tracking of fish abnormal behavior based on improved YOLOV5 and SiamRPN++. Comput. Electron. Agric. 192, 106512. doi: 10.1016/j.compag.2021.106512
Wetzel R. G. (1983). WK kellogg biological station (Hickory Corners (USA: Michigan State Univ.). Limnology.
Wu L., Wang Y., Li J., Song Z., Xu S., Song C., et al. (2021). Influence of light spectra on the performance of juvenile turbot (Scophthalmus maximus). Aquaculture 533, 736191. doi: 10.1016/j.aquaculture.2020.736191
Xi Y., Meng X., Ying-Ping H., Yi-Hong Z., Johnson D. M., Zhi-Ying T. (2019). Color-induced changes in oxygen consumption and swimming performance of juvenile bighead carp (Aristichthys nobilis). Fish Physiol. Biochem. 45, 1771–1777. doi: 10.1007/s10695-019-00671-0
Xiao G., Shao T., Zhu T., Li Y., Mao J., Cheng Z. (2016). "Attention region based approach for tracking individuals in a small school of fish for water quality monitoring," in 12th International Conference on Machine Learning and Data Mining (MLDM). (New York, NY: Springer), 756–760. doi: 10.1007/978-3-319-41920-6_57
Xu J., Lin C., Dai H., Mao J., Ke S., Yin R., et al. (2019). Influence of low-intensity light on phototactic behaviour of Schizothorax oconnori Lloyd. River Res. Appl. 36, 296–304. doi: 10.1002/rra.3580
Yamanome T., Mizusawa K., Hasegawa E., Takahashi A. (2009). Green light stimulates somatic growth in the barfin flounder Verasper moseri. J. Exp. Zool A Ecol. Genet. Physiol. 311, 73–79. doi: 10.1002/jez.497
Yang L., Liu Y., Yu H., Fang X., Song L., Li D., et al. (2020). Computer vision models in intelligent aquaculture with emphasis on fish detection and behavior analysis: A review. Arch. Comput. Methods Eng. 28, 2785–2816. doi: 10.1007/s11831-020-09486-2
Zhang X., Bian Z., Yuan X., Chen X., Lu C. (2020). A review on the effects of light-emitting diode (LED) light on the nutrients of sprouts and microgreens. Trends Food Sci. Technol. 99, 203–216. doi: 10.1016/j.tifs.2020.02.031
Keywords: steelhead trout, fish behavior, behavior quantify, aquaculture environment regulation, light color
Citation: Li Z, Chen X, Huang J, An D and Zhou Y (2024) Behavior analysis of juvenile steelhead trout under blue and red light color conditions based on multiple object tracking. Front. Mar. Sci. 11:1377494. doi: 10.3389/fmars.2024.1377494
Received: 27 January 2024; Accepted: 24 April 2024;
Published: 14 May 2024.
Edited by:
Ana C. Puello Cruz, National Council of Science and Technology (CONACYT), MexicoReviewed by:
Carlos Alfonso Alvarez-González, Universidad Juárez Autónoma de Tabasco, MexicoPablo Almazan Rueda, National Council of Science and Technology (CONACYT), Mexico
Xiaoning Yu, Shandong Technology and Business University, China
Copyright © 2024 Li, Chen, Huang, An and Zhou. This is an open-access article distributed under the terms of the Creative Commons Attribution License (CC BY). The use, distribution or reproduction in other forums is permitted, provided the original author(s) and the copyright owner(s) are credited and that the original publication in this journal is cited, in accordance with accepted academic practice. No use, distribution or reproduction is permitted which does not comply with these terms.
*Correspondence: Dong An, andong@cau.edu.cn; Yangen Zhou, zhouyg@ouc.edu.cn